Fig. 18
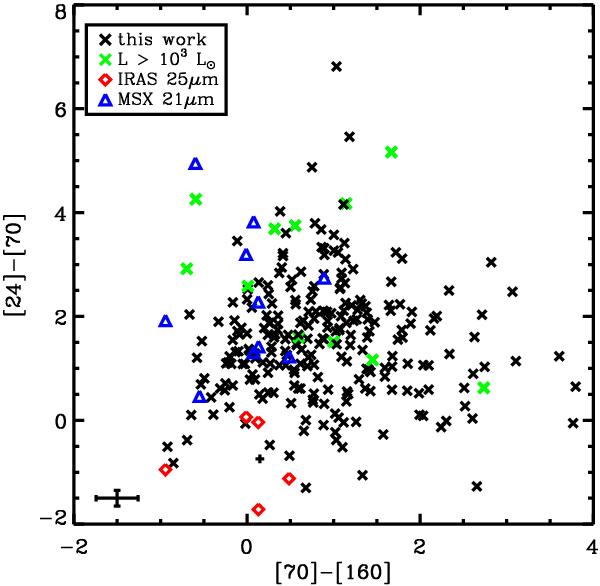
[24] – [70] vs. [70] – [160] color–color diagram including only cores for which 24 μm counterparts exist (black). The high-luminosity sources (L > 103 L⊙) are indicated in green. The typical error is plotted in the lower-left corner. Since very bright sources often saturated the MIPS 24 μm detector, additional data points extracted from the IRAS point source catalog at 25 μm (red diamonds) and the MSX point source catalog at 21 μm (blue triangles) were used in lieu of a MIPS 24 μm data point in this plot. Note that both the IRAS and MSX fluxes were integrated over significantly larger areas corresponding to the beam of the respective telescopes.
Current usage metrics show cumulative count of Article Views (full-text article views including HTML views, PDF and ePub downloads, according to the available data) and Abstracts Views on Vision4Press platform.
Data correspond to usage on the plateform after 2015. The current usage metrics is available 48-96 hours after online publication and is updated daily on week days.
Initial download of the metrics may take a while.