Fig. 16
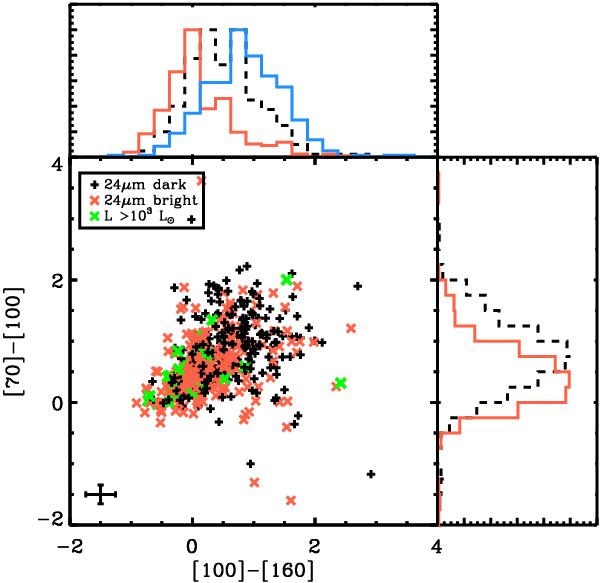
PACS color–color diagram showing the 24 μm-dark cores (red) and 24 μm-bright cores (black). All sources with high luminosities (L > 103 L⊙) are shown in green. The typical error is plotted in the lower-left corner. The right panel shows the distribution of [70] – [100] colors, and the upper panel shows the distribution of [100] – [160] colors for the 24 μm-bright cores (red), 24 μm-dark cores (black), and (in blue) cores for which no counterpart at 70 μm was detected.
Current usage metrics show cumulative count of Article Views (full-text article views including HTML views, PDF and ePub downloads, according to the available data) and Abstracts Views on Vision4Press platform.
Data correspond to usage on the plateform after 2015. The current usage metrics is available 48-96 hours after online publication and is updated daily on week days.
Initial download of the metrics may take a while.