Fig. 15
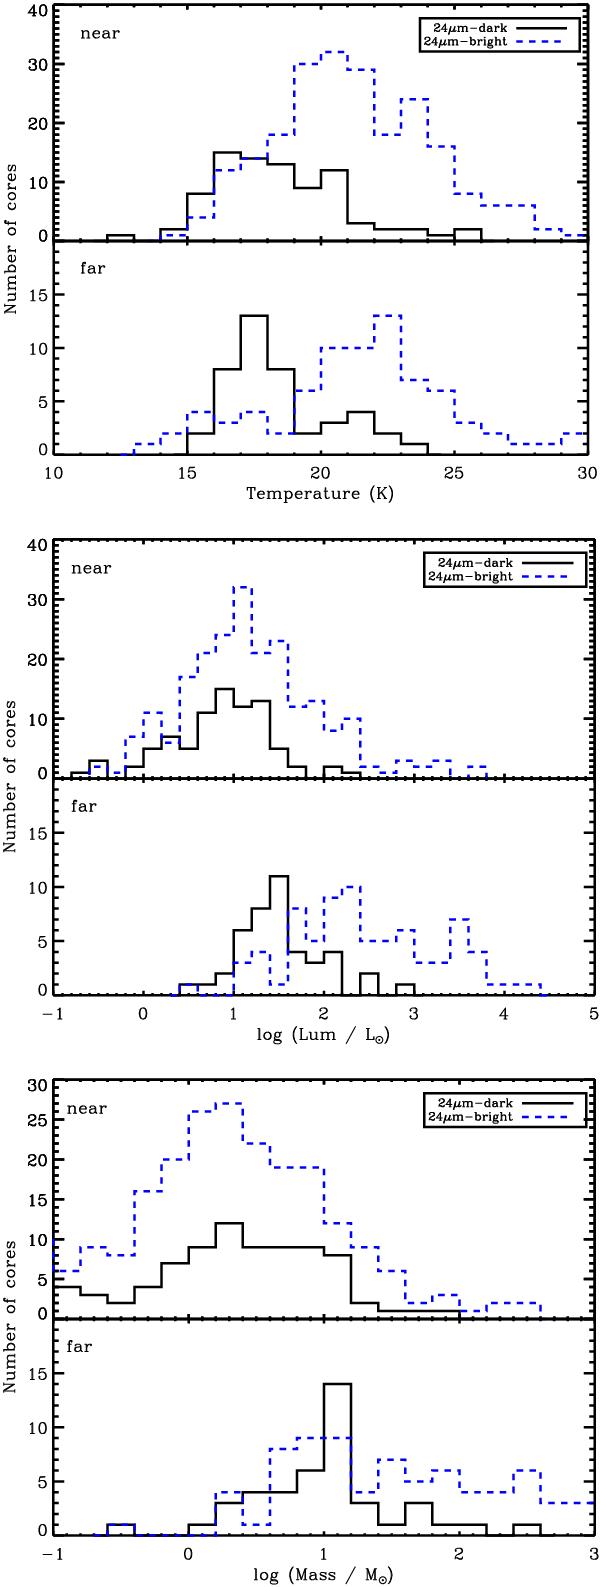
Distribution of point source properties within “near” and “far” IRDCs (top and bottom of each panel, respectively). The top panel shows the temperature distribution; the center panel shows the luminosity distribution, and the bottom panel shows the mass distribution. The black histogram shows objects which have no 24 μm counterpart, and the blue dashed histograms show the distribution of objects with a 24 μm counterpart.
Current usage metrics show cumulative count of Article Views (full-text article views including HTML views, PDF and ePub downloads, according to the available data) and Abstracts Views on Vision4Press platform.
Data correspond to usage on the plateform after 2015. The current usage metrics is available 48-96 hours after online publication and is updated daily on week days.
Initial download of the metrics may take a while.