Fig. 14
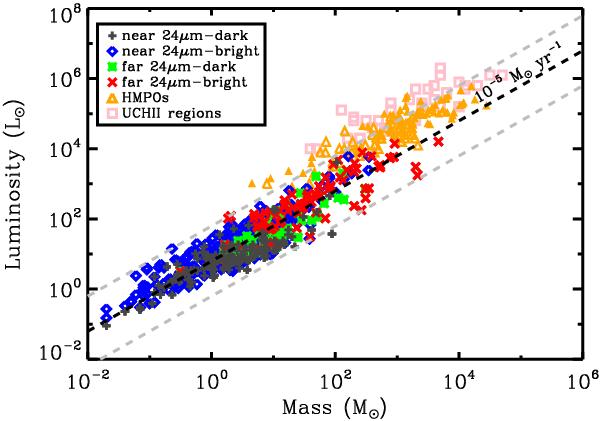
Core luminosity versus core mass. We make four categories of sources: “near” sources, which are closer than 4 kpc, with either a 24 μm counterpart (“bright”) or no 24 μm counterpart (“dark”), and “far” sources with the same bright/dark distinction. For comparison, we plot in orange triangles the Beuther et al. (2002b, 2005a) sample of high-mass protostellar objects (HMPOs) and the Hunter et al. (2000) sample of ultra-compact HII regions in pink squares. With the black dashed line, we plot a line of constant accretion luminosity, Lacc = GṀMstar/Rstar, of 10-5 M⊙ yr-1, assuming Mstar = 0.1 Mcore and Rstar = 5 R⊙, and the range indicated by the grey dashed lines on either side show ± 1 dex variation. See Sect. 6.2 for details.
Current usage metrics show cumulative count of Article Views (full-text article views including HTML views, PDF and ePub downloads, according to the available data) and Abstracts Views on Vision4Press platform.
Data correspond to usage on the plateform after 2015. The current usage metrics is available 48-96 hours after online publication and is updated daily on week days.
Initial download of the metrics may take a while.