Fig. 13
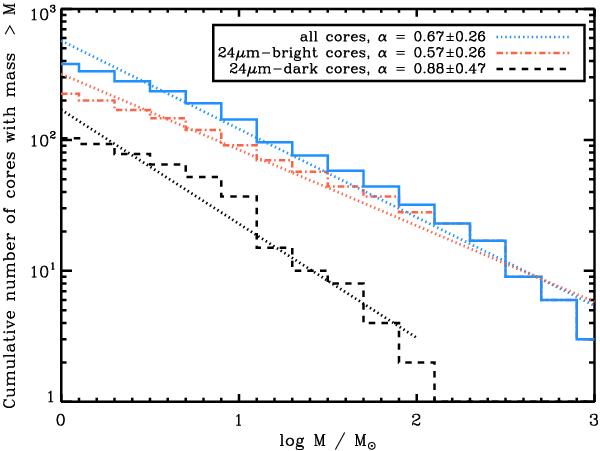
The cumulative mass function of cores more massive than 1 M⊙. The total distribution of all cores is shown in blue solid line; the distribution of 24 μm-bright cores is shown in the red dash-dotted line; the distribution of 24 μm-dark cores is shown in black dashed line. A simple linear regression was fit to each distribution, taking the functional form N(>M) ∝ Mα. For reference, on this scale, a Salpeter slope is α = 1.35.
Current usage metrics show cumulative count of Article Views (full-text article views including HTML views, PDF and ePub downloads, according to the available data) and Abstracts Views on Vision4Press platform.
Data correspond to usage on the plateform after 2015. The current usage metrics is available 48-96 hours after online publication and is updated daily on week days.
Initial download of the metrics may take a while.