Fig. 6
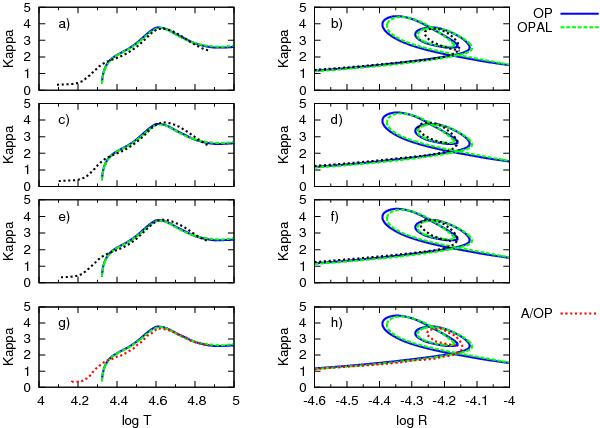
Panel a) The Rosseland-mean opacities, κR [cm2 g-1] , as a function of lgT for ATLAS12/MHD-Q (dotted line) in comparison with OP (continuous line) and OPAL (dashed line) envelope models of Teff = 25 000 K and lgg = 4.0. Panel c) The same as panel a), but OP/IRON bound-free absorptions of metals are included in the ATLAS12/MHD-Q model (dotted line). Panel e) The same as panelc), but OP opacities are used for hydrogen and helium. Panel g) The same as panel a), but the ATLAS12/OP model is plotted by means of an A/OP line. The right-hand side panels show the same as the left-hand side ones, but for the diagrams of κR vs. lgR.
Current usage metrics show cumulative count of Article Views (full-text article views including HTML views, PDF and ePub downloads, according to the available data) and Abstracts Views on Vision4Press platform.
Data correspond to usage on the plateform after 2015. The current usage metrics is available 48-96 hours after online publication and is updated daily on week days.
Initial download of the metrics may take a while.