Fig. 4
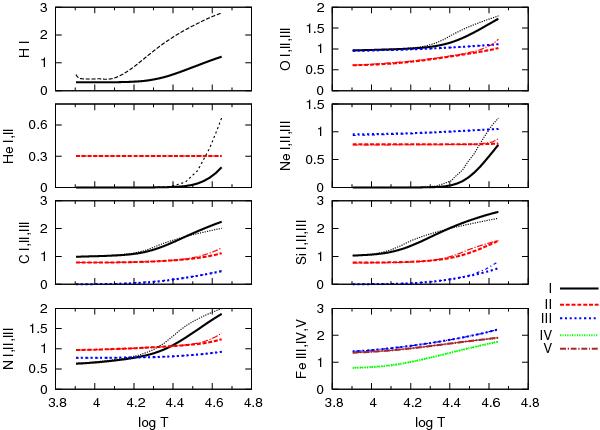
The internal partition functions (in logarithmic units) vs. lgT for ATLAS12/MHD-Q model of Teff = 15 000 K and lgg = 4.0 (thick lines) in comparison with Kurucz’s data shown as thin lines. The panels show H I, He I and II, and the first three ionization stages of C, N, O, Ne and Si, respectively. The lowest right-hand panel shows the same, but for Fe III–V. The ionization states of I–V are plotted by means of lines as explained in the right-hand side of the figure.
Current usage metrics show cumulative count of Article Views (full-text article views including HTML views, PDF and ePub downloads, according to the available data) and Abstracts Views on Vision4Press platform.
Data correspond to usage on the plateform after 2015. The current usage metrics is available 48-96 hours after online publication and is updated daily on week days.
Initial download of the metrics may take a while.