Fig. 2
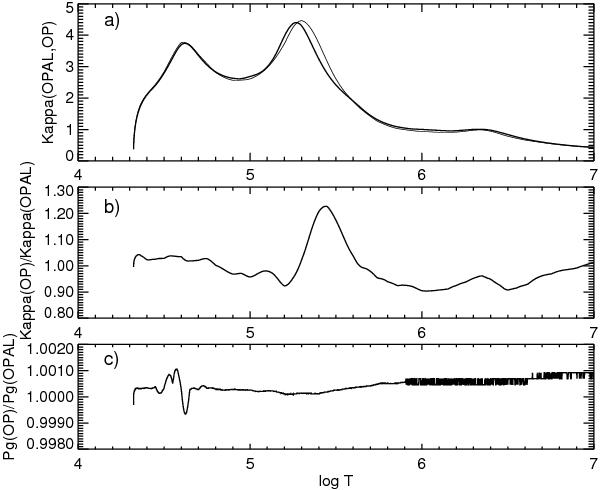
Panel a) The Rosseland-mean opacities, κR [cm2 g-1] , as a function of lgT for OPAL (thick line) and OP (thin line) models of Teff = 25 000 K and lgg = 4.0. The chemical abundance parameters X = 0.708 and Z = 0.0172 are assumed. Panel b) The ratio of OP to OPAL Rosseland-mean opacities are displayed for input parameters of (lgT and lgρ) taken from the OPAL model shown in panel a). Panel c) The same as panel b), but for gas pressures.
Current usage metrics show cumulative count of Article Views (full-text article views including HTML views, PDF and ePub downloads, according to the available data) and Abstracts Views on Vision4Press platform.
Data correspond to usage on the plateform after 2015. The current usage metrics is available 48-96 hours after online publication and is updated daily on week days.
Initial download of the metrics may take a while.