Fig. 9
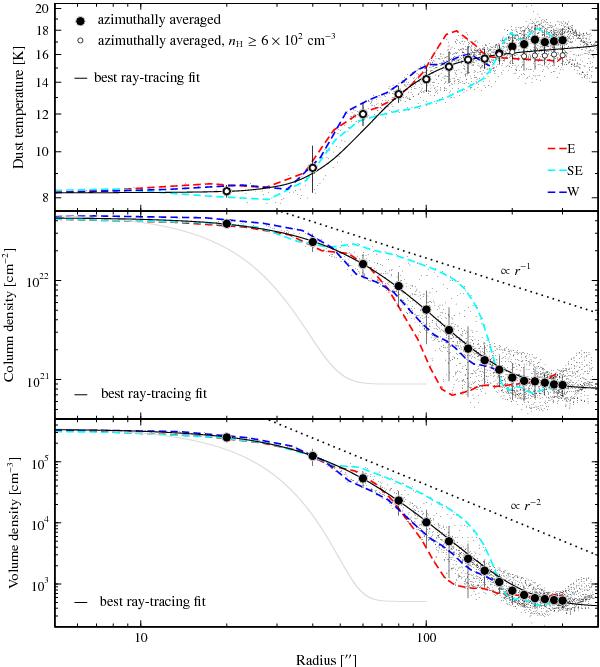
Radial profiles of the dust temperature, the column density and the volume density of B68 based on the distributions shown in Fig. 8. All values of the three maps are presented by the small dots. The big filled dots represent azimuthally averaged values inside 20″ wide annuli. The open white dots in the upper panel show the same for those dust temperatures that are attained at densities above 6 × 102 cm-2. The error bars reflect the 1σ rms scatter of the azimuthal averaging and hence indicate the deviation from the spheroid assumption. We show the best ray-tracing fits to the data that were used to calculate the three maps, indicated by the solid lines. The coloured dashed lines correspond to the radial distributions along three selected directions, as outlined in Fig. 8c. The dotted lines show the canonical density power-laws for self-gravitating isothermal spheres, and the grey curve depicts a Gaussian profile with a FWHM equal to the spatial resolution of the maps.
Current usage metrics show cumulative count of Article Views (full-text article views including HTML views, PDF and ePub downloads, according to the available data) and Abstracts Views on Vision4Press platform.
Data correspond to usage on the plateform after 2015. The current usage metrics is available 48-96 hours after online publication and is updated daily on week days.
Initial download of the metrics may take a while.