Fig. 8
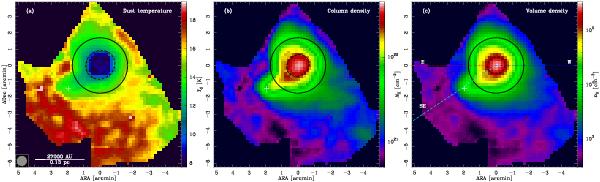
Dust temperature a), column density b), and volume
density c) maps of B68 derived by the ray-tracing algorithm as
described in Sect. 3.2. The maps showing the
dust temperature and the volume density are the ones calculated for the mid-plane
across the plane of the sky. The global temperature minimum coincides with the
density peak and attains a value of 8 K. The central column density is
NH = 4.3 × 1022 cm-2. The
central particle density is
nH = 3.4 × 105 cm-3. The black
solid circles represent the size of the BES fitted by Alves et al. (2001b). The major and the minor axes of the black dashed
ellipses denote the FWHM of the 2D Gaussians fitted to temperature and density peaks
(see text). We have plotted the three cuts through the maps as dashed lines, whose
colours match the ones in the radial profile plots. The white crosses indicate the
location of the point source we have identified and described in Sect. 4.2. The coordinates are given in arcminutes
relative to the centre of the density distributions,
i.e. RA  , Dec = −23°49′50″.
Current usage metrics show cumulative count of Article Views (full-text article views including HTML views, PDF and ePub downloads, according to the available data) and Abstracts Views on Vision4Press platform.
Data correspond to usage on the plateform after 2015. The current usage metrics is available 48-96 hours after online publication and is updated daily on week days.
Initial download of the metrics may take a while.