Free Access
Fig. 5
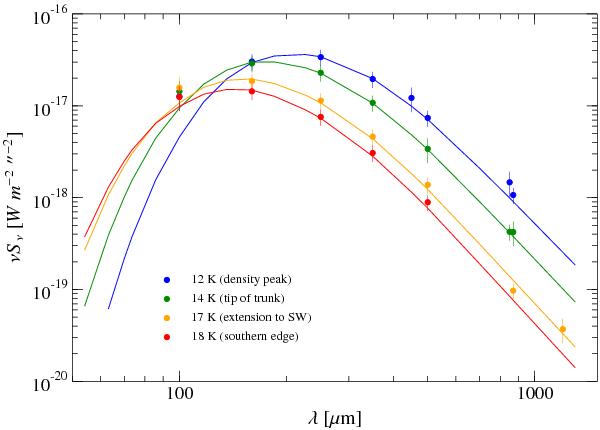
Spectral energy distributions at four selected positions across B68. The dots represent 10″ × 10″ pixel values extracted from the maps that are used for the modified black body fitting. The solid curves are the SEDs fitted for a given dust temperature and column density.
Current usage metrics show cumulative count of Article Views (full-text article views including HTML views, PDF and ePub downloads, according to the available data) and Abstracts Views on Vision4Press platform.
Data correspond to usage on the plateform after 2015. The current usage metrics is available 48-96 hours after online publication and is updated daily on week days.
Initial download of the metrics may take a while.