Fig. 17
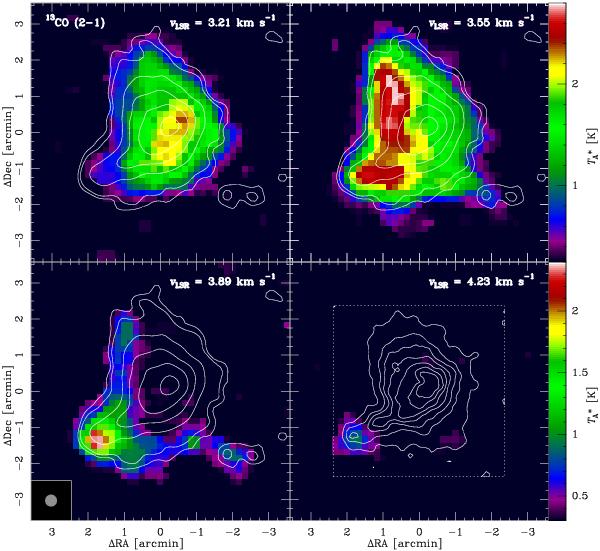
13CO (2–1) channel maps of the molecular line observations of B68. The radial velocities are indicated. The contours superimposed in the upper row and in the left panel of the lower row represent the LABOCA data. The contours in the lower right panel show the extinction map of Alves et al. (2001a). There is a general trend of the radial velocities being somewhat higher towards the eastern edge of B68. The highest velocities at vLSR ≈ 4.1 ± 0.2 km s-1 can be attributed to a point source that coincides with a local density peak at the tip of southeastern extension.
Current usage metrics show cumulative count of Article Views (full-text article views including HTML views, PDF and ePub downloads, according to the available data) and Abstracts Views on Vision4Press platform.
Data correspond to usage on the plateform after 2015. The current usage metrics is available 48-96 hours after online publication and is updated daily on week days.
Initial download of the metrics may take a while.