Fig. 11
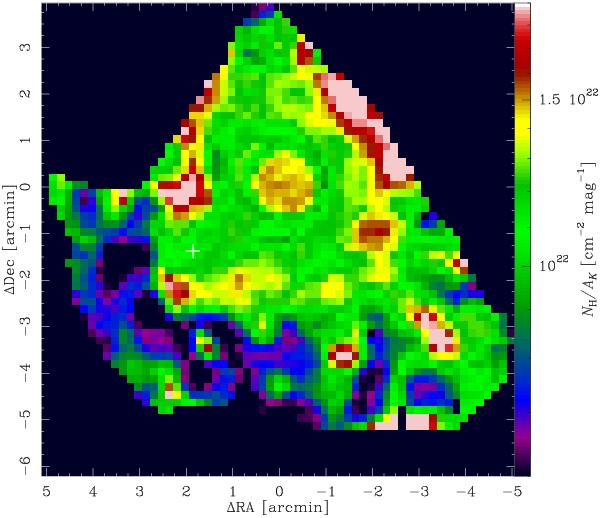
NH vs. AK ratio map. The uncertainties increase strongly beyond a radius of 180′′, because a) the flux densities and extinction values are low towards the southeast, b) the extinction map has a higher uncertainty there, c) edge effects in the modelled flux distribution. The position of the embedded point source is indicated with a white cross.
Current usage metrics show cumulative count of Article Views (full-text article views including HTML views, PDF and ePub downloads, according to the available data) and Abstracts Views on Vision4Press platform.
Data correspond to usage on the plateform after 2015. The current usage metrics is available 48-96 hours after online publication and is updated daily on week days.
Initial download of the metrics may take a while.