Fig. 10
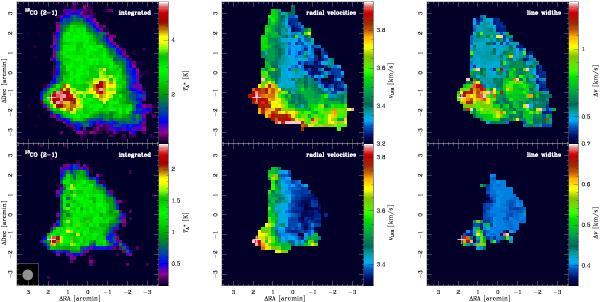
Maps of B68 generated from the CO data. The upper row contains the 12CO (2–1) line data, while the lower row shows the 13CO (2–1) observations. The columns from left to right indicate the line flux integrated over all spectrometer channels, the radial velocity distribution, and the corresponding line widths. The white crosses indicate the position of the point source at the tip of the trunk.
Current usage metrics show cumulative count of Article Views (full-text article views including HTML views, PDF and ePub downloads, according to the available data) and Abstracts Views on Vision4Press platform.
Data correspond to usage on the plateform after 2015. The current usage metrics is available 48-96 hours after online publication and is updated daily on week days.
Initial download of the metrics may take a while.