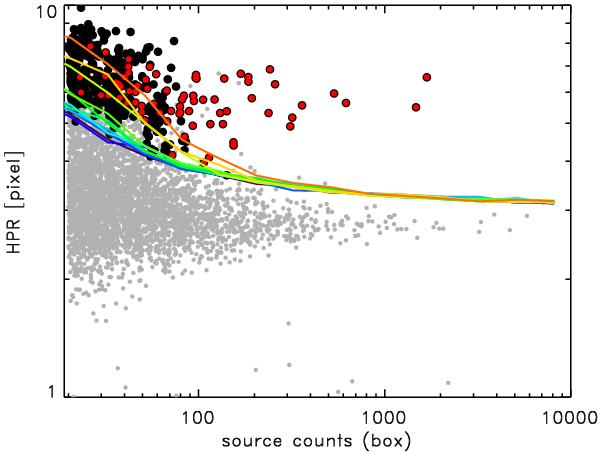
Fig. 8

Distribution of the measured HPR within a box of 45 × 45 arcsec for all the sources detected in the XRT fields as a function of the soft counts measured within the HPR. All possible extended source candidates are marked with black big dots, while red big dots indicate sources with >100 soft net counts from the aperture photometry in the extraction radius (see Sect. 5) and are therefore included in the cluster candidate list. The continuous lines show the typical 99% confidence level envelope for different exposures, from 1 ks (orange line) to 1 Ms (blue line).
Current usage metrics show cumulative count of Article Views (full-text article views including HTML views, PDF and ePub downloads, according to the available data) and Abstracts Views on Vision4Press platform.
Data correspond to usage on the plateform after 2015. The current usage metrics is available 48-96 hours after online publication and is updated daily on week days.
Initial download of the metrics may take a while.


