Fig. 7
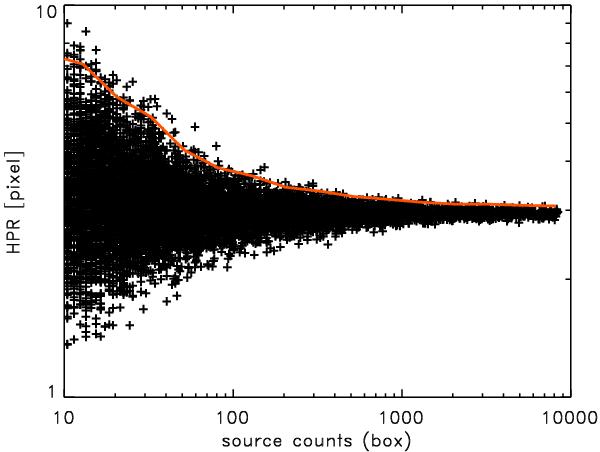
Distribution of the measured HPR within a 45 × 45 arcsec box for simulated unresolved sources as a function of the soft counts within the box. The same range of exposure times and backgrounds present in the real data has been adopted in the simulations. The continuous line shows the 99% confidence level envelope of the source distribution.
Current usage metrics show cumulative count of Article Views (full-text article views including HTML views, PDF and ePub downloads, according to the available data) and Abstracts Views on Vision4Press platform.
Data correspond to usage on the plateform after 2015. The current usage metrics is available 48-96 hours after online publication and is updated daily on week days.
Initial download of the metrics may take a while.