Fig. 6
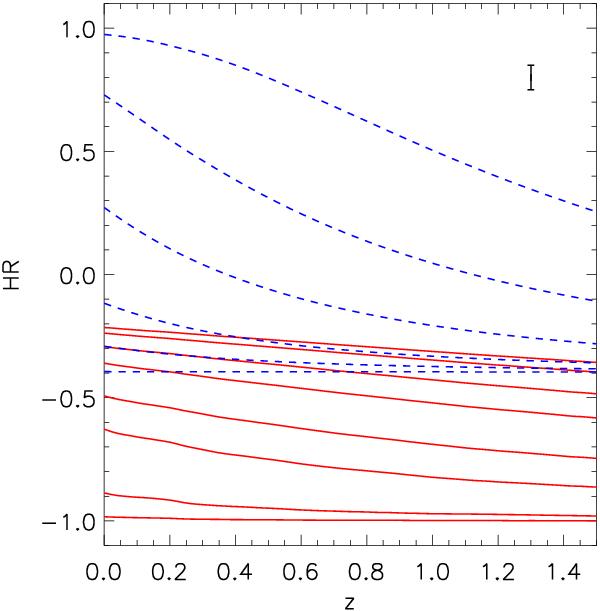
Hardness ratios modeled for XRT as a function of redshift for groups and clusters with several temperatures (red continuous lines, kT respectively equal to 0.5, 1.0, 2.0, 3.0, 5.0, 7.0, 10.0 and 12.0 keV from the bottom to the top) and for AGN with different intrinsic absorption (blue dashed lines, NH respectively equal to 0.01, 0.1, 0.3, 1.0, 3.0 and 10.0 × 1022 cm-2 from the bottom to the top). In the top right, we show the typical error bar on HR for a source with 200 total net counts.
Current usage metrics show cumulative count of Article Views (full-text article views including HTML views, PDF and ePub downloads, according to the available data) and Abstracts Views on Vision4Press platform.
Data correspond to usage on the plateform after 2015. The current usage metrics is available 48-96 hours after online publication and is updated daily on week days.
Initial download of the metrics may take a while.