Free Access
Fig. 13
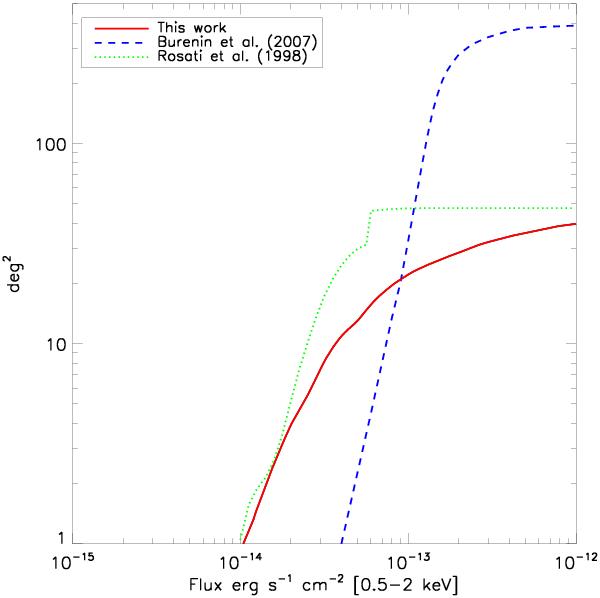
Solid angle Ω covered by our survey as a function of the soft flux. As a comparison, we show also the sky coverage of the 400 Square Degree Survey (Burenin et al. 2007, blue dashed line) and the sky coverage of the RDCS (Rosati et al. 1998, green dotted line).
Current usage metrics show cumulative count of Article Views (full-text article views including HTML views, PDF and ePub downloads, according to the available data) and Abstracts Views on Vision4Press platform.
Data correspond to usage on the plateform after 2015. The current usage metrics is available 48-96 hours after online publication and is updated daily on week days.
Initial download of the metrics may take a while.