Fig. 1
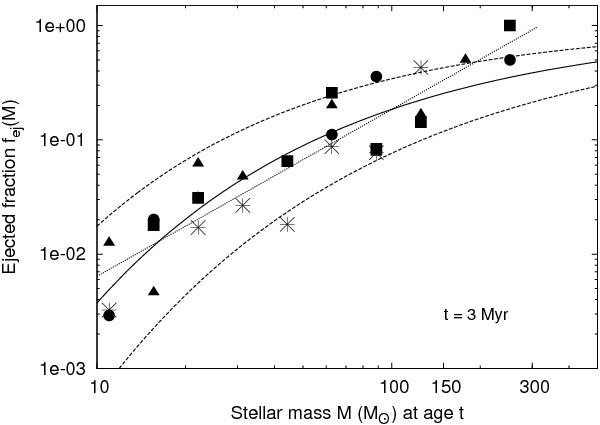
The fraction fej(M) of runaway stars for M > 10 M⊙ at t ≈ 3 Myr cluster age as obtained from the four computations of Paper I (cf. Fig. 4 of Paper I). We use the same symbols as in Fig. 4 of Paper I to indicate that they are obtained from direct N-body computations starting with different initial realizations of the R136 model employed in Paper I. The central solid line represents the best-fit line to the data that asymptotes to unity (see Sect. 4). The upper and the lower dashed lines limit the error in the fitting. The dotted line is the best-fit single power-law to the entire data which is truncated at fej(M) = 1 (see Sect. 4).
Current usage metrics show cumulative count of Article Views (full-text article views including HTML views, PDF and ePub downloads, according to the available data) and Abstracts Views on Vision4Press platform.
Data correspond to usage on the plateform after 2015. The current usage metrics is available 48-96 hours after online publication and is updated daily on week days.
Initial download of the metrics may take a while.