Fig. 12
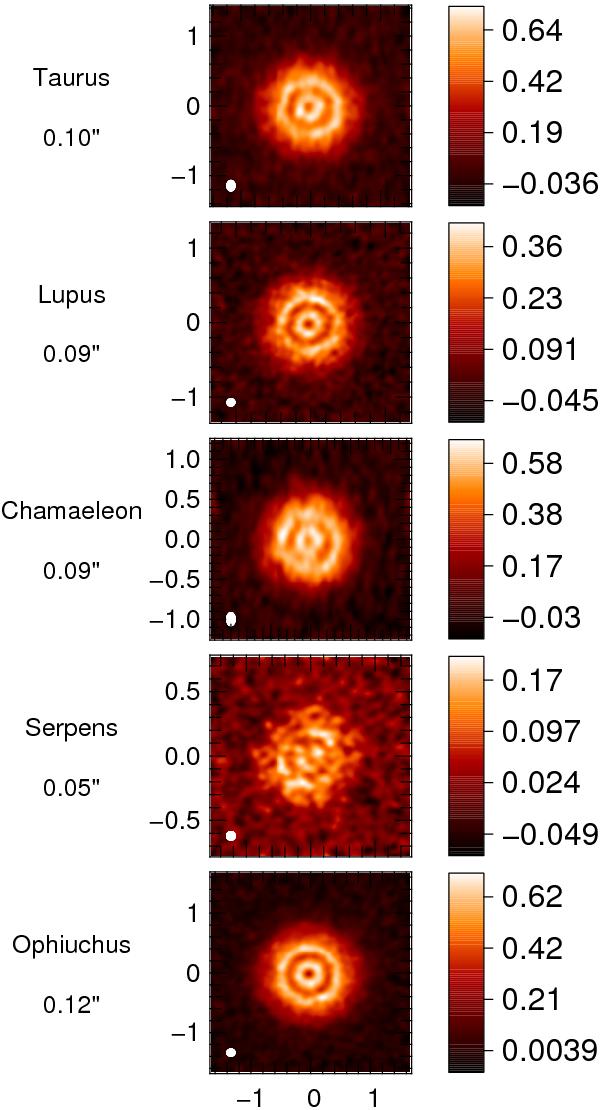
Simulated observations of disks located in the star-forming regions listed in Table 3 for the 1 MJ planet in the dynamic case at λ = 850 μm with an integration time of 1 h. The angular resolution for each image is given on the left (it corresponds to an identical spatial resolution for all star forming regions), together with the region’s name. The scale on each image is in arcseconds, with the beam size represented at its bottom left corner, and the colorbar gives the flux in mJy/beam.
Current usage metrics show cumulative count of Article Views (full-text article views including HTML views, PDF and ePub downloads, according to the available data) and Abstracts Views on Vision4Press platform.
Data correspond to usage on the plateform after 2015. The current usage metrics is available 48-96 hours after online publication and is updated daily on week days.
Initial download of the metrics may take a while.