Fig. 4
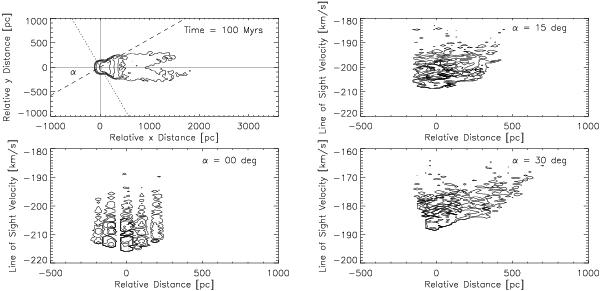
Projected velocity-space distribution of Setup 3 without a DM halo at a maximum refinement level of 7. Top left panel: contour lines of the column density distribution (in z direction) at log (NHI) = 18.8 ... 21.2 Hcm-2 steps of 0.6 dex 100 Myr after the simulation onset. Both the x- and the y-coordinates correspond to the Cartesian grid of the 3D data cube. Radial velocities measurable along the line-of-sight (dashed line) in different directions of angle α = 0 deg,15 deg, and 30 deg with respect to the x-direction are shown in the 3 frames from bottom left (α = 0deg), through top right (α = 15deg) to bottom right (α = 30deg). Along the abscissa, projected distances perpendicular to the line-of-sight (dotted line) through the mass center (x = 0) are shown. All cells with densities n > 0.01 H cm-3 are included and re-arranged to represent the column density distribution in the observed position-velocity space (leading to the bubbled contour structure). The contour lines of the line-of-sight column densities indicate log (NHI) = 18, 19, 20,and21 H cm-2. The measured maximum velocities differ accordingly from 215 (for α = 0deg) to 188 km s-1 (α = 30deg).
Current usage metrics show cumulative count of Article Views (full-text article views including HTML views, PDF and ePub downloads, according to the available data) and Abstracts Views on Vision4Press platform.
Data correspond to usage on the plateform after 2015. The current usage metrics is available 48-96 hours after online publication and is updated daily on week days.
Initial download of the metrics may take a while.