Fig. 3
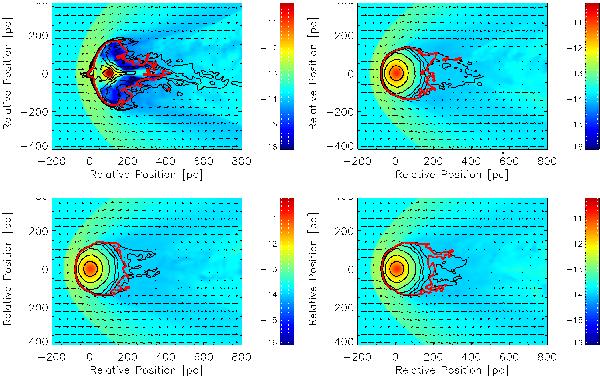
HVC model with an initial gas mass of Mgas = 4.4 × 10⁵ M⊙ (Setup 2-DD): color-coded pressure distribution (logarithmic scale [dyne cm-2]) through the midplane (z = 0) of the 3D simulation box overlaid with Hi column density contours between log (NHI) = 18.5...21.5 cm-2 in steps of 0.5 dex, 100 Myr after the onset. Upper left panel: cloud without DM (Run VI), upper right panel: cloud embedded in an NFW halo (see Sect. 4.3.3); lower panels: clouds with Burkert halos with r0 = 150 pc (Run VII, left panel) and r0 = 250 pc (Run IX, right panel), respectively. The red contour depicts the (Ekin + Ei) = −Epot boundary and encloses all material, both from the cloud and from the hot halo gas, which is gravitationally bound to the HVC. The velocity vectors indicate a maximum velocity of 215 km s-1 and their lengths are linearly scaled.
Current usage metrics show cumulative count of Article Views (full-text article views including HTML views, PDF and ePub downloads, according to the available data) and Abstracts Views on Vision4Press platform.
Data correspond to usage on the plateform after 2015. The current usage metrics is available 48-96 hours after online publication and is updated daily on week days.
Initial download of the metrics may take a while.