Fig. A.2
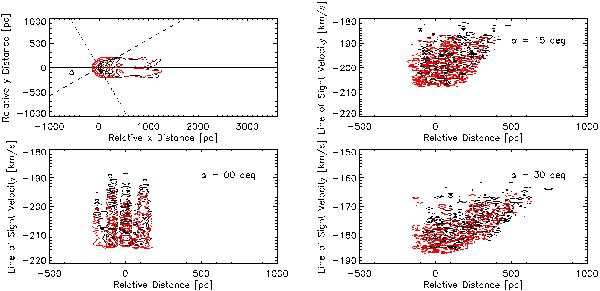
Setup 2 with (red contour lines) and without a DM halo (black contour lines) at a maximum refinement level of 6. In the top left panel the contour lines represent the column density distribution log (NHI) = 18.8 ... 21.2 Hcm-2 in 0.6 dex after 100 Myr of simulation time. For the line-of-sight plots in the panels on the right side and the panel at the bottom left, contour lines are at log (NHI) = 18, 19, 20,and21 H cm-2. The angle α determines the inclination of the line of sight, for details see caption of Fig. 4.
Current usage metrics show cumulative count of Article Views (full-text article views including HTML views, PDF and ePub downloads, according to the available data) and Abstracts Views on Vision4Press platform.
Data correspond to usage on the plateform after 2015. The current usage metrics is available 48-96 hours after online publication and is updated daily on week days.
Initial download of the metrics may take a while.