Free Access
Fig. A.1
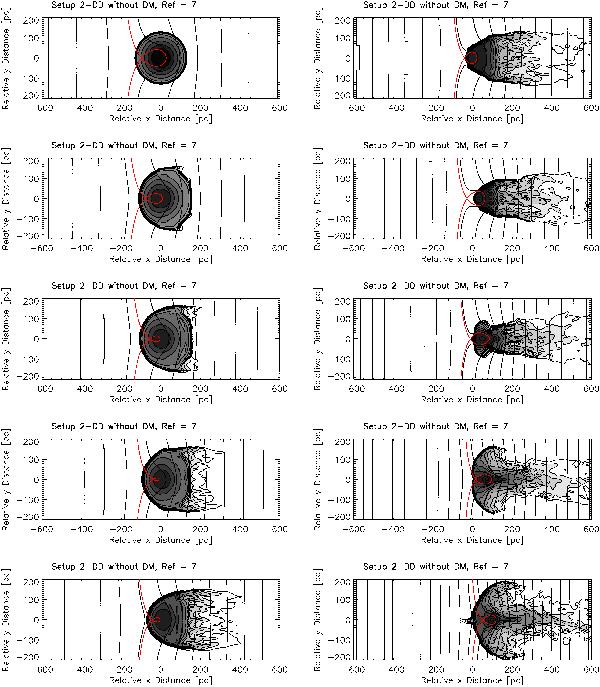
Setup 2-DD. Time evolution of the column density and the equipotential distribution. Contours as in Fig 2. From top to bottom, on the lefthand side the panels show snapshots at 0, 20, 30, 40, and 50 Myr and on the righthand at 60, 70, 80, 90, and 100 Myr after the simulation onset.
Current usage metrics show cumulative count of Article Views (full-text article views including HTML views, PDF and ePub downloads, according to the available data) and Abstracts Views on Vision4Press platform.
Data correspond to usage on the plateform after 2015. The current usage metrics is available 48-96 hours after online publication and is updated daily on week days.
Initial download of the metrics may take a while.