Fig. 13
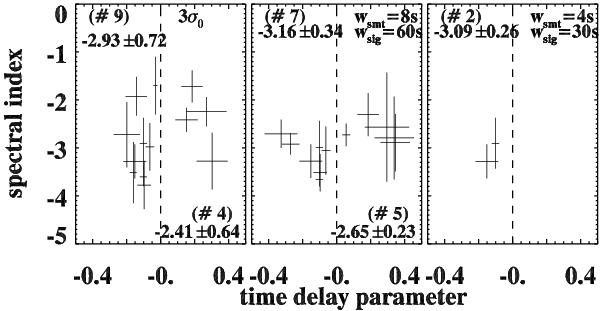
Scatter plot of the spectral index versus the time delay parameter α of spikes selected with various criteria. In each panel, positive α values refer to high-energy delayed events while negative ones refer to low-energy delayed spikes. These two populations are separated by the vertical dashed line, and the number of the spikes, and the mean count spectral index Γ and its standard deviation of each population are also marked in each panel.
Current usage metrics show cumulative count of Article Views (full-text article views including HTML views, PDF and ePub downloads, according to the available data) and Abstracts Views on Vision4Press platform.
Data correspond to usage on the plateform after 2015. The current usage metrics is available 48-96 hours after online publication and is updated daily on week days.
Initial download of the metrics may take a while.