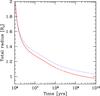
Fig. 5
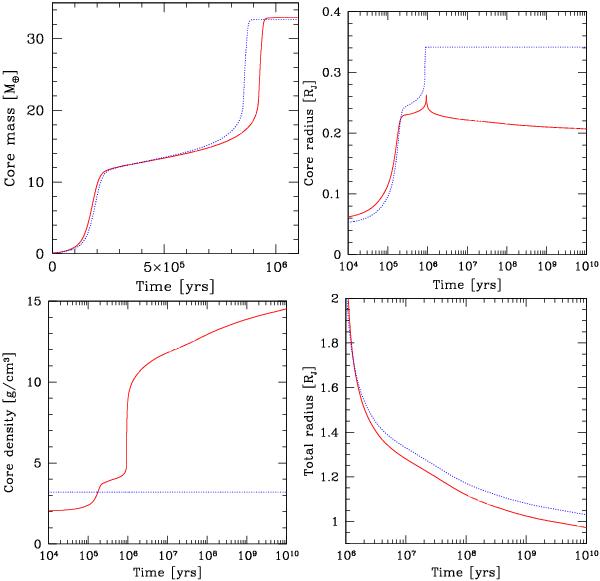
Effect of variable core density on the in situ formation and evolution of Jupiter. In each panel, red solid lines show the case of a variable core density, while blue dotted lines correspond to a constant core density of 3.2 g/cm3. The top left panel shows the core mass as a function of time during the formation phase; afterwards it is constant. The top right panel is the radius of the core. The local maximum for the variable density case occurs at about 1 Myr. The bottom left panel is the mean core density. The bottom right panel finally shows the total radius of the planet during the long-term evolution.
Current usage metrics show cumulative count of Article Views (full-text article views including HTML views, PDF and ePub downloads, according to the available data) and Abstracts Views on Vision4Press platform.
Data correspond to usage on the plateform after 2015. The current usage metrics is available 48-96 hours after online publication and is updated daily on week days.
Initial download of the metrics may take a while.