Fig. B.1
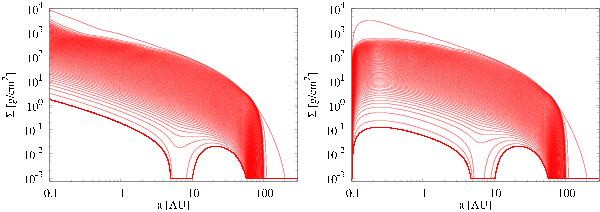
Gas surface density Σ in a protoplanetary disk as a function of distance and time. The surface density is plotted in intervals of 2 × 10⁴ years. The uppermost line shows a state shortly after the beginning of disk evolution. The lowermost line is the profile when the calculation is stopped. The two panels differ from each other by the boundary condition that is used at the inner edge of the disk at 0.1 AU, as described in the text. All other parameters are identical and given as M∗ = 1 M⊙, α = 7 × 10⁻³ and Σ0 = 200 g/cm2.
Current usage metrics show cumulative count of Article Views (full-text article views including HTML views, PDF and ePub downloads, according to the available data) and Abstracts Views on Vision4Press platform.
Data correspond to usage on the plateform after 2015. The current usage metrics is available 48-96 hours after online publication and is updated daily on week days.
Initial download of the metrics may take a while.