Fig. 14
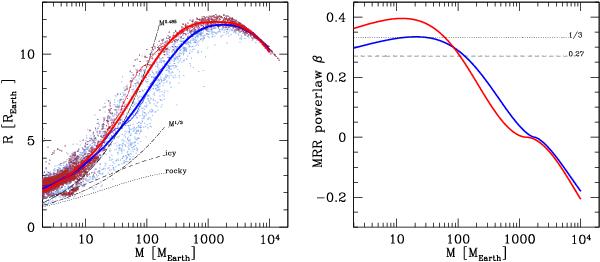
Left panel: synthetic M − R
relationship with analytical approximations for the mean
radius  .
Blue dots: synthetic planets with
0.1 < a/AU. Thick blue line: analytical
fit. Thin blue line: running mean. Red dots: synthetic planets with
0.1 < a/AU ≤ 1. Thick red line:
analytical fit. Thin red line: running mean. Black lines:
M − R relationship for
β = 1/3 and 0.485, for solid planets with an
Earth-like composition, and for planets with a composition as expected beyond the
ice line. Right panel: power-law exponent β for
the
.
Blue dots: synthetic planets with
0.1 < a/AU. Thick blue line: analytical
fit. Thin blue line: running mean. Red dots: synthetic planets with
0.1 < a/AU ≤ 1. Thick red line:
analytical fit. Thin red line: running mean. Black lines:
M − R relationship for
β = 1/3 and 0.485, for solid planets with an
Earth-like composition, and for planets with a composition as expected beyond the
ice line. Right panel: power-law exponent β for
the  relationship
as function of mass.
relationship
as function of mass.
Current usage metrics show cumulative count of Article Views (full-text article views including HTML views, PDF and ePub downloads, according to the available data) and Abstracts Views on Vision4Press platform.
Data correspond to usage on the plateform after 2015. The current usage metrics is available 48-96 hours after online publication and is updated daily on week days.
Initial download of the metrics may take a while.