Fig. 13
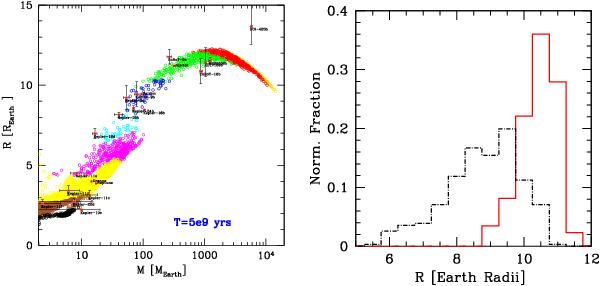
Left panel: synthetic M − R relationship as in Fig. 10, but including only synthetic planets with a final semimajor axis smaller than 1 AU. The color coding and the observational comparison sample is the same as in Fig. 10. Right panel: distribution of radii of planets with masses between 100 and 300 M⊕. The red solid line is for planets with a semimajor axis less than 1 AU, while the black dashed-dotted line shows planets outside of this distance. Planets reaching the inner border of the computational disk have been excluded. The age of the population is 5 Gyr.
Current usage metrics show cumulative count of Article Views (full-text article views including HTML views, PDF and ePub downloads, according to the available data) and Abstracts Views on Vision4Press platform.
Data correspond to usage on the plateform after 2015. The current usage metrics is available 48-96 hours after online publication and is updated daily on week days.
Initial download of the metrics may take a while.