Fig. 12
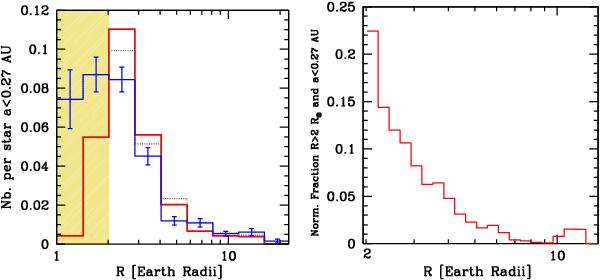
Left panel: number of planets per star in a given radius bin and an orbital period P < 50 d (a < 0.27 AU for a 1 M⊙ star). The thick red line is the synthetic population. The blue line with error bars is from Howard et al. (2012) for the Kepler data of Feb. 2011 (Borucki et al. 2011). The black dotted line is the preliminary analysis of Howard et al. (2011) for the data of Sep. 2011 (Batalha et al. 2012). The observational data in the hatched region with R < 2 R⊕ is incomplete. Right panel: normalized fraction of radii of the same synthetic planets as on the left, but with finer bins, and including only planets with R > 2 R⊕.
Current usage metrics show cumulative count of Article Views (full-text article views including HTML views, PDF and ePub downloads, according to the available data) and Abstracts Views on Vision4Press platform.
Data correspond to usage on the plateform after 2015. The current usage metrics is available 48-96 hours after online publication and is updated daily on week days.
Initial download of the metrics may take a while.