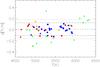
Fig. 8
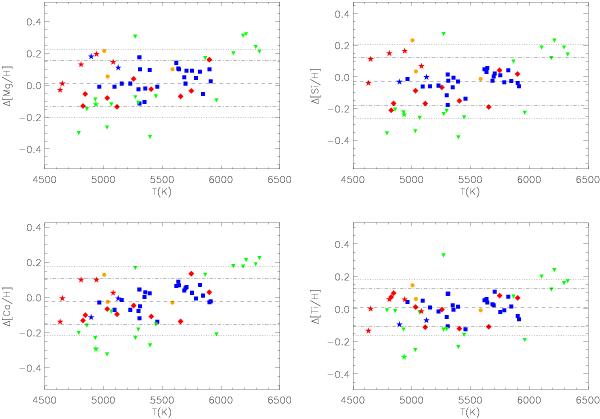
Δ[X/H] differential abundances (for the α-elements Mg, Si, Ca, and Ti vs. Teff). Dashed-dotted lines represent 1-rms over and below the median for our sample, whereas dotted lines represent the 1.5-rms level. Dashed lines represent the mean differential abundance. Red diamonds are stars compatible within 1-rms with the Fe abundance but not for all elements, blue squares are the candidates selected to become members of the Hyades Supercluster, while green triangles are rejected candidates and starred points are the giants. Blue squares and starred points are the final selected candidates to become members of the Hyades Supercluster. BZ Cet, V683 Per, and ϵ Tau are indicated by orange circles.
Current usage metrics show cumulative count of Article Views (full-text article views including HTML views, PDF and ePub downloads, according to the available data) and Abstracts Views on Vision4Press platform.
Data correspond to usage on the plateform after 2015. The current usage metrics is available 48-96 hours after online publication and is updated daily on week days.
Initial download of the metrics may take a while.