Fig. 5
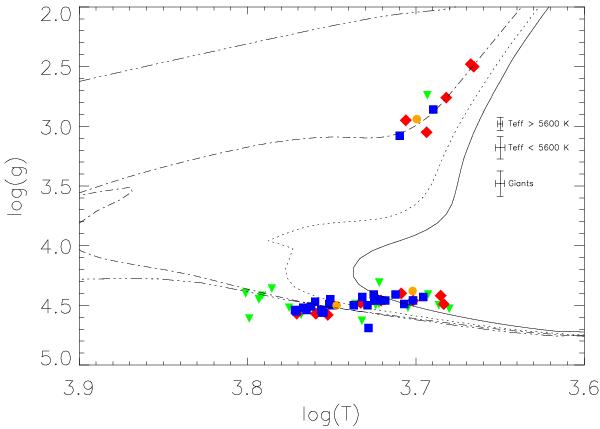
Spectroscopic log Teff vs. log g for the candidate stars. We have employed the Yonsei-Yale ischrones (Demarque et al. 2004) for Z = 0.025 and 0.1, 0.7, 4, and 13 Gyr (from left to right). Mean error bars are represented at the middle right. Blue squares represent stars selected as members by the chemical tagging approach, red diamonds represent those stars that have similar Fe abundances, but different values of other elements. Orange circles represent three Hyades cluster stars (BZ Cet, V683 Per and ϵ Tau). Green triangles represent those stars that do not have similar Fe abundances (as well as dissimilar values of other elements).
Current usage metrics show cumulative count of Article Views (full-text article views including HTML views, PDF and ePub downloads, according to the available data) and Abstracts Views on Vision4Press platform.
Data correspond to usage on the plateform after 2015. The current usage metrics is available 48-96 hours after online publication and is updated daily on week days.
Initial download of the metrics may take a while.