| Issue |
A&A
Volume 546, October 2012
|
|
|---|---|---|
| Article Number | A80 | |
| Number of page(s) | 4 | |
| Section | Interstellar and circumstellar matter | |
| DOI | https://doi.org/10.1051/0004-6361/201220200 | |
| Published online | 11 October 2012 | |
Research Note
Observations of the post-shock break-out emission of SN 2011dh with XMM-Newton⋆
Institut für Astronomie und Astrophysik, Universität Tübingen,
Sand 1,
72076
Tübingen,
Germany
e-mail: sasaki@astro.uni-tuebingen.de
Received: 10 August 2012
Accepted: 16 September 2012
Context. After the occurrence of the type cIIb SN 2011dh in the nearby spiral galaxy M 51 numerous observations were performed with different telescopes in various bands ranging from radio to γ-rays.
Aims. We analysed the XMM-Newton and Swift observations taken 3 to 30 days after the SN explosion to study the X-ray spectrum of SN 2011dh.
Methods. We extracted spectra from the XMM-Newton observations, which took place ~7 and 11 days after the SN. In addition, we created integrated Swift/XRT spectra of 3 to 10 days and 11 to 30 days.
Results. The spectra can be well-fitted with a power-law spectrum absorbed with Galactic foreground absorption. In addition, we find a harder spectral component in the first XMM-Newton spectrum taken at t ≈ 7 d. This component is also detected in the first Swift spectrum of t = 3–10 d.
Conclusions. While the persistent component can be explained as inverse Compton emission from radio synchrotron emitting electrons or emission of the reverse shock, the harder component is most likely bremsstrahlung emission from the shocked stellar wind. Therefore, the harder X-ray emission that fades away after t ≈ 10 d can be interpreted as emission from the shocked circumstellar wind of SN 2011dh.
Key words: shock waves / circumstellar matter / supernovae: individual: SN2011dh
© ESO, 2012
1. Introduction
Massive stars at the end of their lives have undergone phases of more or less strong mass loss. The evolution of the stars and thus also the way their supernovae (SNe) evolve, depend strongly on their mass loss rates. The interaction of the SN shock wave with the stellar wind creates a hot region around the SN site in which electrons are accelerated and produce radio synchrotron emission. The hot plasma around the SNe can be observed in X-rays. Strong X-ray emission is in particular expected when the SN shock wave breaks out of the star and starts propagating into the circumstellar material (Chevalier & Irwin 2011, 2012, and references therein). Owing to prompt observations with the Swift or the Chandra telescope, X-rays from the interaction of the SN shock with the circumstellar matter have been detected for a number of SNe (e.g., SN 2006jc or SN 2010jl, Immler et al. 2008; Chandra et al. 2012, respectively). Soderberg et al. (2008) detected a transient X-ray source with Swift, which was then identified as SN 2008D in the galaxy NGC 2770. The X-ray outburst was ascribed to the shock break-out of the SN.
On May 31, 2011, a supernova explosion was observed (Silverman et al. 2011) in the nearby galaxy M 51 located at a distance of 8.4 ± 0.7 Mpc (Vinkó et al. 2012). It was classified as a type IIb SN (Arcavi et al. 2011a). Several radio, optical, and X-ray observations followed to study the SN evolution, which also allowed to constrain the nature of the progenitor, suggesting a compact progenitor star with a radius of ~1011 cm and thus the classification of SN 2011dh as a type cIIb SN (Arcavi et al. 2011b; Soderberg et al. 2012).
Soderberg et al. (2012) studied SN 2011dh using Swift and Chandra data in X-rays and the Submillimeter Array, the Combined Array for Research in Millimeter-wave Astronomy, and the Expanded Very Large Array in radio in the following weeks. They showed that the observed radio emission is synchrotron radiation of electrons, accelerated in the forward shock of the SN explosion, while inverse Compton (IC) scattering of these electrons produced X-rays. The authors estimated that the break-out of the shock out of the compact progenitor must have occured at Rbr ≈ 4×1011 cm with a rise time for the break-out pulse of tbr ≈ 1 min. However, the shock break-out pulse was not detected by any X-ray or γ-ray observatory.
We report the detection of a hard X-ray component in the early spectra of SN 2011dh observed with XMM-Newton and Swift. The comparison of the spectra taken at different times after the SN event ranging from t = 3 to 30 d allows us to consider this component as emission from the interaction of the SN shock with the circumstellar material in the immediate surroundings of the progenitor star.
2. Data
2.1. XMM-Newton data
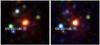 |
Fig. 1 XMM-Newton EPIC-pn images ~ 7 d (left) and ~ 11 d (right) after the SN explosion in the colours red (0.3–1.0 keV), green (1.0–2.0 keV), and blue (2.0–8.0 keV). |
Shortly after SN 2011dh occured, two observations with XMM-Newton were initiated. The first observation with the ObsID 0677980701 was performed at t ≈ 7 d after the SN explosion from 2011/06/07, 5:19:56 to 2011/06/07, 8:30:40 (UTC) with an exposure of ~11 ks. All European Photon Imaging Cameras (EPICs, Strüder et al. 2001; Turner et al. 2001) were operated in full-frame mode and used with the thin filter. The next observation took place from 2011/06/11, 5:05:03 to 2011/06/11, 8:15:38 (UTC) at t ≈ 11 d with ~10 ks exposure. The EPICs were used in the same configuration as in the observations before. After filtering good time intervals, only 4 and 2.6 ks of useful data remained for the observations 0677980701 and 0677980801, respectively.
Owing to low statistics, the MOS1/2 data are not useful for further analysis. Therefore, we created images from the EPIC-pn data in the bands 0.3–1.0 keV, 1.0–2.0 keV, and 2.0–8.0 keV (Fig. 1). As can be seen in the EPIC-pn images, the X-ray source at the position of SN 2011dh is brighter on 2011/06/07 than on 2011/06/11 and also appears to be more blue. The red-orange appearing source in the centre is the nucleus of M 51 together with an unresolved ultra-luminous X-ray source (ULX). The other brighter blue or green sources are also ULXs in M 51 (Dewangan et al. 2005).
We extracted EPIC-pn spectra of SN 2011dh in a circular region with a radius of 20′′ around the optical position. The background spectrum was extracted in a 30′′ radius circle close to the source, where no X-ray source was detected. Hereafter, we call the EPIC-pn spectrum of 2011/06/07 spectrum XMM1 and that of 2011/06/11 spectrum XMM2.
2.2. Swift data
SN 2011dh was also observed with the Swift satellite in a large number of observations to study the evolution of the X-ray emission. Soderberg et al. (2012) derived the X-ray fluxes of SN 2011dh from Swift observations taken with the X-ray telescope (XRT) from 2011/06/03 to 29 and analysed the integrated spectrum from the observations of 2011/06/03 to 17. Since we aim to study the Swift spectra at times comparable to the XMM-Newton observations, we collected XRT observations of SN 2011dh starting ~3 d after the SN explosion, in the time period from 2011/06/03 12:04:02 (UT) to 2011/06/10 17:08:32 (total exposure time of ~44 ks) and in a later period from 2011/06/11 04:55:01 to 2011/06/30 12:33:50 (total exposure time of ~85 ks). The XRT data obtained in photon-counting (PC) mode were processed with the standard procedures (XRTPIPELINE v.0.12.6, Burrows et al. 2005). Standard grade filtering (0–12) and screening criteria were applied.
Events for the spectral analysis were accumulated within the same circular regions as for the XMM-Newton spectra, i.e., with 20′′ radius centred on the optical position of the SN for the source spectrum and from a source-free circular region of radius 30′′ close to the SN for the background. We used version v.013 of the response matrices in HEASARC calibration database (CALDB) and the corresponding ancillary response files created using the task XRTMKARF. We call the integrated spectrum of 2011/06/03 to 10 spectrum Swift1 and that of 2011/06/11 to 30 spectrum Swift2.
3. Spectral analysis
The spectrum Swift1 is merged from the data of 2011/06/03 to 10 and thus represents an average spectrum of before 2011/06/10. Similarly, spectrum Swift2 is an average spectrum of after 2011/06/11. Therefore, the four analysed spectra have the following chronological order: Swift1, XMM1, XMM2, and Swift2, with Swift1 and XMM1 corresponding to spectra taken at similar times.
3.1. The longer persistent soft X-ray emission
We analysed the two XMM-Newton and two Swift spectra simultaneously to search for changes in the spectral components. Pooley (2011) reported that the Chandra spectrum taken on 2011/06/12 can be fitted with a power-law spectrum with a photon index of Γ = 1.4 ± 0.3, absorbed by the Galactic foreground NH = 1.8×1020 cm-2. For the Swift spectra from 2011/06/03 to 17, Soderberg et al. (2012) determined a photon index of Γ = 0.9–1.8. We therefore fitted the spectra first with a single power-law model, also assuming foreground absorption by Galactic NH = 1.8×1020 cm-2. The first two spectra Swift1 and XMM1 can be fitted with a lower photon index of Γ = 1.1 (1.0−1.3)1Allerrorsinthispapergiveninbracketsareat90%confidencelevel. with red. χ2 = 1.1 and d.o.f. = 33, whereas the spectra XMM2 and Swift2 taken after 2011/06/11 are fitted well with Γ = 1.8 (1.5−2.0) with red. χ2 = 1.1 and d.o.f. = 23. Therefore, the spectra taken on the first ~10 days after the SN are significantly different from the subsequent spectra.
We also fitted all spectra with a single thermal bremsstrahlung model. While the temperatures fitted for the first two spectra (t < 10 d) are unconstrained (kTbrems,Swift1 > 9 keV and kTbrems,XMM1 > 22 keV, respectively), the two later spectra (t > 11 d) are both fitted well with temperatures of kTbrems,XMM2 = 3(1−18) keV and kTbrems,Swift2 = 3(2−8) keV (red. χ2 = 1.1 at d.o.f. = 56).
3.2. The fading hard X-ray emission
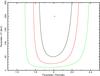 |
Fig. 2 Confidence level contours (63, 90, and 99%) for the parameters kTbrems and Γ. |
A likely origin of the additional harder component in the earlier spectra is free-free emission from the shocked circumstellar wind (Chevalier & Fransson 2003). If we keep the power-law component and include an additional free-free emission component for the earlier spectra Swift1 and XMM1, the photon indices of their power-law component become higher with Γ = 2.0 (1.6–2.5) (red. χ2 = 1.1 at d.o.f. = 32). Moreover, we obtain an additional absorbing column density of NHintr = 7.2 (1.3–15.0)×1020 cm-2. The flux of the power-law component is the same for all four spectra with the unabsorbed flux being Fpow(0.3−8.0 keV) = 1.1(0.8−1.5)×10-13 erg cm-2 s-1. The temperature of the bremsstrahlung component is poorly constrained and we can only determine a lower limit of kTbrems > 42 keV. Figure 2 shows the confidence contours for the parameters kTbrems and Γ. The unabsorbed flux of the bremsstrahlung component is Fbrems(0.3−8.0 keV) = 1.3(0.9−1.7)×10-13 erg cm-2 s-1 and 1.1(0.7−1.6)×10-13 erg cm-2 s-1 for Swift1 and XMM1, i.e., for t < 10 d and t = 7 d, respectively. While this component has disappeared at t = 11 d with an upper limit of the unabsorbed flux of Fbrems(0.3−8.0 keV) < 0.6×10⁻¹³ erg cm-2 s-1, the power-law component seems to represent emission that is persistent up to 30 d or longer. Figure 3 shows the first two spectra Swift1 and XMM1 with a model consisting of a bremsstrahlung and a power-law component (upper diagram), while the later spectra XMM2 and Swift2 are shown with the single power-law fits (lower diagram).
Immler & Lewin (2003), on the other hand, discussed the presence of a blackbody continuum of the shocked hot circumstellar gas. If we fit the spectra Swift1 and XMM1 with a blackbody model for the additional hard component, we obtain a temperature of kTBB = 1.6(1.7−2.8) keV. The luminosities are LBB(<10 d) = 1.6(0.8−3.7)×1039 erg s-1 and LBB(7 d) = 1.6(0.8−3.1)×1039 erg s-1 for Swift1 and XMM1, respectively. From the fits of the spectra XMM2 and Swift2, we obtain the following upper limits: LBB(11 d) < 0.8×1039 erg s-1 and for XMM1, LBB(11−30 d) < 0.3×1039 erg s-1.
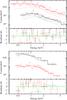 |
Fig. 3 X-ray spectra of SN 2011dh: stacked Swift spectrum for t < 10 d (Swift1, black in the upper diagram), XMM-Newton EPIC-pn spectrum taken at t ≈ 7 d (XMM1, red in the upper diagram), XMM-Newton EPIC-pn spectrum taken at t ≈ 11 d (XMM2, black in the lower diagram), and stacked Swift spectrum for 11 < t < 30 d (Swift2, red in the lower diagram). The spectra in the upper diagram are fitted with a combined power-law + bremsstrahlung spectrum, while the spectra in the lower diagram are fitted with a power-law spectrum only. The Swift spectra appear at a lower countrate per energy bin due to the lower effective area of the detector. |
4. Discussion
Many SNe show a softening of their X-ray spectrum days to months after the SN event (e.g., Immler & Kuntz 2005, and references therein). If the X-ray emission is mainly caused by an IC process, as proposed for SN 2011dh by Soderberg et al. (2012), one expects dLX/dE ∝ E−(p − 1)/2, with p being the spectral index of the energy of the injected electrons responsible also for the radio synchrotron emission (e.g., Chevalier et al. 2006). This, of course, is based on the simple assumption that the particle spectrum does not change over a broad spectral range. In reality, some acceleration processes or particle losses can modify the spectrum. As the power-law fits of XMM1 and Swift1 vs. Swift2 and XMM2 have shown, the photon indices are significantly different (Γ = 1.1 [1.0–1.3] and 1.8 [1.5–2.0], respectively) and indicate a temporal change in the X-ray spectrum. Assuming that the particle spectrum does not change its shape significantly, the softening of the X-ray spectrum is most likely not caused by the change of the slope of the non-thermal spectrum, but rather by the change of the emission components. The X-ray emitting gas behind the blast wave of the SN shock is expected to have high temperatures of 100 keV or higher, while the gas behind the reverse shock is cooler (~1–10 keV, Immler 2003). Hence a likely explanation for the softening of the X-ray spectrum is that the reverse shock emission becomes more dominant.
The analysis of the XMM-Newton EPIC-pn and Swift XRT spectra of SN 2011dh have shown that the X-ray spectrum changes during ~10 d after the SN event. If we assume that the longer persistent X-ray emission component can be interpreted as thermal bremsstrahlung, we obtain a temperature of ~3 keV after t ≈ 11 d, i.e., ~3×10⁷ K, corresponding to a shock velocity of ~1500 km s-1, which is far lower than what was measured in the optical spectra at these times (~10 000 km s-1, Arcavi et al. 2011b). Therefore, this component is better identified as reverse shock emission or IC emission. In this case, the additional hot component observed only until ~10 d after the SN event might be emission from circumstellar gas shocked by the forward shock.
A similar X-ray emission was also detected for SN 1993J with ROSAT a few days after the SN explosion, which occured in the galaxy M 81 at a distance of 3.6 kpc (Zimmermann et al. 1994). This emission was fitted well with a power-law spectrum with Γ = 1.0 ± 0.25 or a bremsstrahlung spectrum with kTbrems > 7 keV, and decreased exponentially during the ~40 d in which it was observed.
Assuming free-free emission for the hard component, we obtain a lower limit for the temperature of kTbrems > 42 keV. The flux at t = 7 d is Fbrems(0.3−8.0 keV) = (1.1 ± 0.5)×10-13 erg cm-2 s-1, corresponding to Lbrems(0.3−8.0 keV) ≈ 9.3×1038 erg s-1. Using the lower limit for the temperature, we obtain a lower limit for the shock velocity of 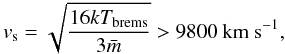 (1)with a mean mass per free particle for fully ionised plasma of
  . Soderberg et al. (2012) estimated vs ≈ 0.1 c, which is about three times higher than this lower limit. The XMM-Newton and Swift spectra that only extend up to ~10 keV do not allow us to constrain the temperature for a bremsstrahlung model. Using vs ≈ 0.1 c derived by Soderberg et al. (2012), we estimate that at t = 7 d, the shock must have reached a radius of Rs ≈ vst ≈ 1.8×1015 cm. Therefore, from the bremsstrahlung spectrum at t = 7 d, we derive a down-stream density of n = 6.4×107 cm-3 at Rs ≈ 1.8×1015 cm.
On the other hand, we can also estimate the stellar wind density based on the assumption made about the progenitor star. SN 2011dh was classified as a type IIb SN with a compact progenitor, making a Wolf-Rayet (WR) star a likely progenitor candidate (Chevalier & Soderberg 2010). The number density of the wind at a distance r from the WR star is given by the continuity equation: 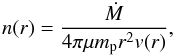 (2)where Ṁ is the mass-loss rate, μ is the mean atomic weight of the wind material, and v(r) is the β-velocity law (Castor et al. 1975):
 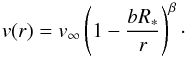 (3)R ∗ is the stellar radius, v∞ the terminal velocity, b = 0.9983 a parameter that ensures that v(R ∗ ) > 0, and β = 4–8 for WR stars (Schmutz 1997). The volume integral of equation (2) over a shell with radii Rbr and Rs centred at the position of the WR star gives the total number of particles:
 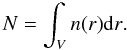 (4)Thus, from Eq. (4), it is possible to obtain the average number density in that shell:
 ![\begin{equation} \label{n average} \bar{n} = N \times \left[ \frac{4}{3}\pi \left(R_{\rm s}^3 -R_{\rm br}^3\right) \right]^{-1} \mbox{.} \end{equation}](/articles/aa/full_html/2012/10/aa20200-12/aa20200-12-eq87.png) (5)Soderberg et al. (2012) estimated a stellar radius of R ∗ = 1011 cm, a shock break-out radius of Rbr = 4×1011 cm, and a mass loss rate of Ṁ = 3×10⁻⁵ M⊙ yr-1. With a typical wind velocity of v∞ = 103 km s-1 and Rs = 1.8×1015 cm at t = 7 d, we obtain a mean stellar wind density of
(5)Soderberg et al. (2012) estimated a stellar radius of R ∗ = 1011 cm, a shock break-out radius of Rbr = 4×1011 cm, and a mass loss rate of Ṁ = 3×10⁻⁵ M⊙ yr-1. With a typical wind velocity of v∞ = 103 km s-1 and Rs = 1.8×1015 cm at t = 7 d, we obtain a mean stellar wind density of  from Eq. (5). This calculation is based on the assumption that the stellar wind density is highest close to the stellar surface and
decreases with ~r-2. However, the stellar wind material might as well form a dense shell around the star at a certain distance, as was most likely the case for SN 2006jc (Immler et al. 2008). This SN showed an increase in X-rays about 100 days after the explosion, which was interpreted as emission from shock-heated shell at Rs ≈ 1016 cm with a thickness of ΔR ≈ 2×1015 cm. A similar condition may have been the case also for SN 2011dh, but with a shell located closer to the star, which resulted in an earlier rise and decay of the X-ray emission.
5. Summary
Two XMM-Newton observations of SN 2011dh performed ~7 and 11 days after the discovery revealed that the X-ray spectrum changes significantly at about 10 days after the explosion. The analysis of the XMM-Newton EPIC-pn spectra and additional stacked Swift/XRT spectra extracted from many observations of similar periods supports the existence of two spectral components, of which the harder disappeared after ~10 days. The softer component can be identified either as IC emission, as suggested by Soderberg et al. (2012), or as reverse shock emission with an unabsorbed flux of Fsoft(0.3−8.0 keV) ≈ 1×10-13 erg cm-2 s-1 up to t ≈ 30 d. The flux of the hard component, if we assume that it is bremsstrahlung emission, is Fbrems(0.3−8.0 keV) = (1.1 ± 0.5)×10-13 erg cm-2 s-1 at t = 7 d, and therefore comparable to the soft component, and decreases quickly thereafter. This indicates that this emission has its origin in the circumstellar matter that extends to ~1015 cm and was heated by the SN shock.
Acknowledgments
This research has made use of data obtained from the High Energy Astrophysics Science Archive Research Center (HEASARC), provided by NASA’s Goddard Space Flight Center. This work was support by the Deutsche Forschungsgemeinschaft through the Emmy Noether Research Grant SA 2131/1.
References
- Arcavi, I., Gal-Yam, A., Polishook, D., et al. 2011a, The Astronomer’s Telegram, 3413, 1 [NASA ADS] [Google Scholar]
- Arcavi, I., Gal-Yam, A., Yaron, O., et al. 2011b, ApJ, 742, L18 [NASA ADS] [CrossRef] [Google Scholar]
- Burrows, D. N., Hill, J. E., Nousek, J. A., et al. 2005, Space Sci. Rev., 120, 165 [NASA ADS] [CrossRef] [Google Scholar]
- Castor, J. I., Abbott, D. C., & Klein, R. I. 1975, ApJ, 195, 157 [NASA ADS] [CrossRef] [Google Scholar]
- Chandra, P., Chevalier, R. A., Irwin, C. M., et al. 2012, ApJ, 750, L2 [NASA ADS] [CrossRef] [Google Scholar]
- Chevalier, R. A., & Fransson, C. 2003, in Supernovae and Gamma-Ray Bursters, ed. K. Weiler, Lect. Notes Phys. (Berlin: Springer Verlag), 598, 171 [Google Scholar]
- Chevalier, R. A., & Soderberg, A. M. 2010, ApJ, 711, L40 [NASA ADS] [CrossRef] [Google Scholar]
- Chevalier, R. A., & Irwin, C. M. 2011, ApJ, 729, L6 [Google Scholar]
- Chevalier, R. A., & Irwin, C. M. 2012, ApJ, 747, L17 [NASA ADS] [CrossRef] [Google Scholar]
- Chevalier, R. A., Fransson, C., & Nymark, T. K. 2006, ApJ, 641, 1029 [NASA ADS] [CrossRef] [Google Scholar]
- Dewangan, G. C., Griffiths, R. E., Choudhury, M., Miyaji, T., & Schurch, N. J. 2005, ApJ, 635, 198 [NASA ADS] [CrossRef] [Google Scholar]
- Immler, S. 2003, in High Energy Processes and Phenomena in Astrophysics, eds. X. D. Li, V. Trimble, & Z. R. Wang, IAU Symp., 214, 113 [Google Scholar]
- Immler, S., & Kuntz, K. D. 2005, ApJ, 632, L99 [NASA ADS] [CrossRef] [Google Scholar]
- Immler, S., & Lewin, W. H. G. 2003, in Supernovae and Gamma-Ray Bursters, Lect. Notes Phys. (Berlin: Springer Verlag), ed. K. Weiler, 598, 91 [Google Scholar]
- Immler, S., Modjaz, M., Landsman, W., et al. 2008, ApJ, 674, L85 [NASA ADS] [CrossRef] [Google Scholar]
- Pooley, D. 2011, The Astronomer’s Telegram, 3456, 1 [NASA ADS] [Google Scholar]
- Schmutz, W. 1997, A&A, 321, 268 [NASA ADS] [Google Scholar]
- Silverman, J. M., Filippenko, A. V., & Cenko, S. B. 2011, The Astronomer’s Telegram, 3398, 1 [Google Scholar]
- Soderberg, A. M., Berger, E., Page, K. L., et al. 2008, Nature, 453, 469 [NASA ADS] [CrossRef] [PubMed] [Google Scholar]
- Soderberg, A. M., Margutti, R., Zauderer, B. A., et al. 2012, ApJ, 752, 78 [NASA ADS] [CrossRef] [Google Scholar]
- Strüder, L., Briel, U., Dennerl, K., et al. 2001, A&A, 365, L18 [NASA ADS] [CrossRef] [EDP Sciences] [Google Scholar]
- Turner, M. J. L., Abbey, A., Arnaud, M., et al. 2001, A&A, 365, L27 [NASA ADS] [CrossRef] [EDP Sciences] [Google Scholar]
- Vinkó, J., Takáts, K., Szalai, T., et al. 2012, A&A, 540, A93 [NASA ADS] [CrossRef] [EDP Sciences] [Google Scholar]
- Zimmermann, H.-U., Lewin, W., Predehl, P., et al. 1994, Nature, 367, 621 [NASA ADS] [CrossRef] [Google Scholar]
All Figures
|
Fig. 1 XMM-Newton EPIC-pn images ~ 7 d (left) and ~ 11 d (right) after the SN explosion in the colours red (0.3–1.0 keV), green (1.0–2.0 keV), and blue (2.0–8.0 keV). |
| In the text | |
|
Fig. 2 Confidence level contours (63, 90, and 99%) for the parameters kTbrems and Γ. |
| In the text | |
|
Fig. 3 X-ray spectra of SN 2011dh: stacked Swift spectrum for t < 10 d (Swift1, black in the upper diagram), XMM-Newton EPIC-pn spectrum taken at t ≈ 7 d (XMM1, red in the upper diagram), XMM-Newton EPIC-pn spectrum taken at t ≈ 11 d (XMM2, black in the lower diagram), and stacked Swift spectrum for 11 < t < 30 d (Swift2, red in the lower diagram). The spectra in the upper diagram are fitted with a combined power-law + bremsstrahlung spectrum, while the spectra in the lower diagram are fitted with a power-law spectrum only. The Swift spectra appear at a lower countrate per energy bin due to the lower effective area of the detector. |
| In the text | |
Current usage metrics show cumulative count of Article Views (full-text article views including HTML views, PDF and ePub downloads, according to the available data) and Abstracts Views on Vision4Press platform.
Data correspond to usage on the plateform after 2015. The current usage metrics is available 48-96 hours after online publication and is updated daily on week days.
Initial download of the metrics may take a while.