Fig. 3
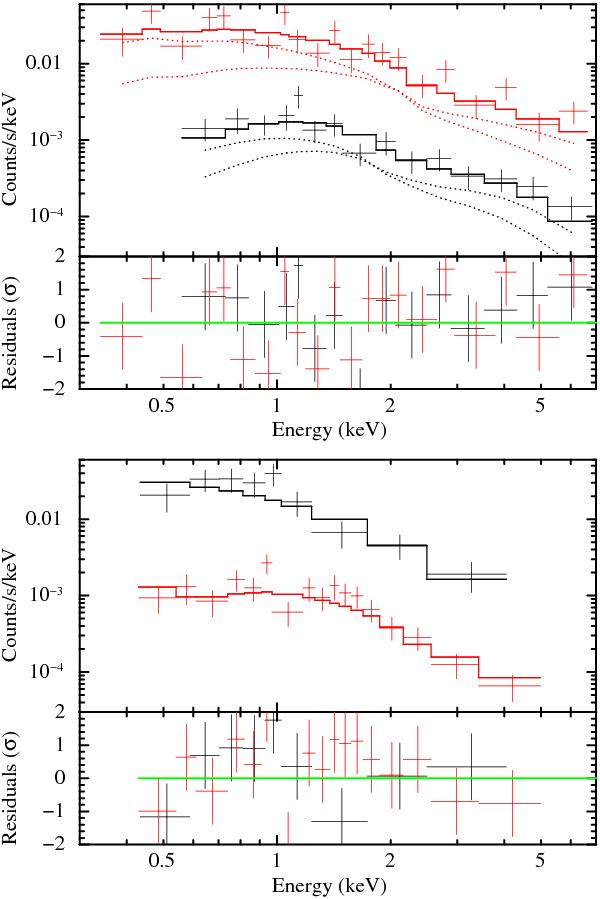
X-ray spectra of SN 2011dh: stacked Swift spectrum for t < 10 d (Swift1, black in the upper diagram), XMM-Newton EPIC-pn spectrum taken at t ≈ 7 d (XMM1, red in the upper diagram), XMM-Newton EPIC-pn spectrum taken at t ≈ 11 d (XMM2, black in the lower diagram), and stacked Swift spectrum for 11 < t < 30 d (Swift2, red in the lower diagram). The spectra in the upper diagram are fitted with a combined power-law + bremsstrahlung spectrum, while the spectra in the lower diagram are fitted with a power-law spectrum only. The Swift spectra appear at a lower countrate per energy bin due to the lower effective area of the detector.
Current usage metrics show cumulative count of Article Views (full-text article views including HTML views, PDF and ePub downloads, according to the available data) and Abstracts Views on Vision4Press platform.
Data correspond to usage on the plateform after 2015. The current usage metrics is available 48-96 hours after online publication and is updated daily on week days.
Initial download of the metrics may take a while.