Fig. 3
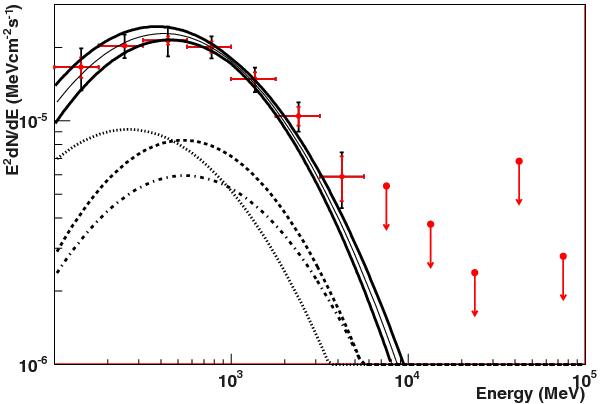
Spectral energy distribution of the gamma-ray emission from HB 21 modeled as a flat circle of 1.125 radius. Red error bar is statistical uncertainty. An additional systematic uncertainty of 10% (E < 560 MeV) and of 5% (E > 560 MeV) is represented by the black error bar. The solid thin black curve is the log-parabola (Eq. (3)) used to model the overall spectrum. Curves with extreme values of α and β, within statistical uncertainty are also shown (solid thick black curves). Dotted, dashed, and dash-dotted curves are the best spectral descriptions for segments NW, S, and NE respectively (see Table 2).
Current usage metrics show cumulative count of Article Views (full-text article views including HTML views, PDF and ePub downloads, according to the available data) and Abstracts Views on Vision4Press platform.
Data correspond to usage on the plateform after 2015. The current usage metrics is available 48-96 hours after online publication and is updated daily on week days.
Initial download of the metrics may take a while.