| Issue |
A&A
Volume 546, October 2012
|
|
|---|---|---|
| Article Number | A97 | |
| Number of page(s) | 15 | |
| Section | Atomic, molecular, and nuclear data | |
| DOI | https://doi.org/10.1051/0004-6361/201219923 | |
| Published online | 11 October 2012 | |
Benchmarking atomic data for astrophysics: a first look at the soft X-ray lines
DAMTP, Centre for Mathematical Sciences, Wilberforce Road,
Cambridge
CB3 0WA,
UK
e-mail: g.del-zanna@damtp.cam.ac.uk
Received: 29 June 2012
Accepted: 7 August 2012
A collection of the best solar and laboratory spectra in the soft X-rays is used to perform a preliminary benchmark in this wavelength region, by comparing observed with predicted wavelengths and calibrated solar irradiances. The benchmark focuses on the Fe ix – Fe xiv ions, for which we have recently calculated the relevant atomic data; however, a few other ions have also been benchmarked. The iron ions dominate the soft X-rays, however a large fraction of the strongest soft X-ray lines due to n = 4 → n = 3 transitions were previously unidentified. The strongest transitions are all identified here, in particular the decays from the core-excited levels (3s 3pl 4s, l = 5,4,3,2,1 for Fe x, Fe xi, Fe xii, Fe xiii, and Fe xiv, respectively), which are the strongest soft X-ray transitions from these ions. Many new identifications are proposed, some only tentatively. Good agreement in terms of solar irradiances between the soft-Xray and EUV (n = 3 → n = 3) transitions is found, confirming the reliability of the new large-scale calculations. Some of the new atomic data and identifications are particularly important for the Solar Dynamic Observatory (SDO) Atmospheric Imaging Assembly (AIA) 94 Å band.
Key words: atomic data / line: identification / techniques: spectroscopic / Sun: corona
© ESO, 2012
1. Introduction
The soft X-ray (50–170 Å) spectrum is rich in n = 4 → n = 3 transitions from highly ionised iron ions, from Fe viii to Fe xvi (see, e.g. Fawcett et al. 1972; Manson 1972; and Behring et al. 1972). Various current missions routinely observe the soft X-rays: for example, Chandra with the LETG, and the Solar Dynamic Observatory (SDO) with a suite of instruments. The SDO Extreme ultraviolet Variability Experiment (EVE; Woods et al. 2012) has been providing soft X-ray irradiances longwards of 60 Å, while the Atmospheric Imaging Assembly (AIA, see Lemen et al. 2012) has been observing, for the first time routinely, the solar corona in two broad-bands centred in the soft X-rays, around 94 and 131 Å.
Very little atomic data were available in the soft X-rays, and the majority of the spectral lines still await firm identification. Within the APAP network (www.apap-network.org), we are carrying out a long-term project for calculating accurate atomic data for the soft X-rays. We started with the Fe viii–Fe xiv iron ions. The atomic data for Fe viii and Fe ix have recently been discussed in O’Dwyer et al. (2012), where new DW calculations for these two ions were presented. The main problems related to calculating accurate atomic data for the n = 4 levels are discussed in Del Zanna et al. (2012b), where new large-scale R-matrix atomic calculations for Fe x are presented. A similar work on Fe xi, Fe xii, and Fe xiii has been presented in Del Zanna & Storey (2012a,b) and Del Zanna et al. (2012a). New atomic data for Fe xiv and Fe xvi have also been calculated recently with the R-matrix method by Liang et al. (2010) and Liang et al. (2009).
It is therefore now possible to provide the first benchmark study of the soft X-rays for these iron ions, based on accurate atomic calculations. Previously, Lepson et al. (2002) provided some tentative identifications for Fe vii – Fe x based on EBIT laboratory measurements and unpublished distorted wave (DW) calculations. Liang & Zhao (2010) discuss Fe ix – Fe xvi emission lines using DW calculations obtained with the flexible atomic code (FAC) and Chandra LETG observations of Procyon. However, various problems with this work have been found. First, almost all of their identifications were either previously known or are at odds with the present results. Second, large discrepancies between observed and predicted line fluxes were present. Third, the Procyon spectra were poor in terms of signal and spectral resolution, when compared to the solar spectra used in the present benchmark.
Recently, Testa et al. (2012) also used Chandra LETG observations of Procyon to benchmark CHIANTI v.6 (Dere et al. 1997, 2009) data; however, no atomic data for the Fe x – Fe xiv were available, with the exception of old (and incorrect) DW scattering calculations for Fe x.
This paper is one in a series (see Del Zanna et al. 2004, hereafter Paper I) that aims to assess atomic data needed for the analysis of astrophysical spectra by benchmarking them against all available experimental data. The approach is observation-based; i.e., it focuses on the brightest spectral lines that are observed in astrophysical spectra. The paper is organised as follows. In Sect. 2, we give a brief review of the previous observations we used for the benchmark. In Sect. 3 we present our results and in Sect. 4 we reach our conclusions.
2. Previous observations and line identifications
The best soft X-ray spectra of the Sun in terms of radiometric calibration are currently provided by the SDO EVE spectrometers. The SDO EVE spectra are calibrated with the use of sounding rockets that carry copies of the flight instruments, which in turn are carefully calibrated before and after each flight against a standard source. On 2008 April 14, a prototype of the EVE instrument was flown (hereafter PEVE). It provided an excellent EUV spectrum of the quiet Sun (Woods et al. 2009; Chamberlin et al. 2009; Del Zanna et al. 2010), which we use here for the benchmark. The F10.7 radio flux on that day was only 69. Indeed during the previous extended minimum the solar corona was very quiet (Del Zanna & Andretta 2011). One drawback of the EVE spectra is the low spectral resolution (about 1 Å), so the majority of the lines are blended.
Very few solar soft X-ray high-resolution spectra exist, all obtained with rocket flights in the 1960s and observing the Sun as a star. As discussed in Del Zanna et al. (2010); Del Zanna & Andretta (2011), there is now good evidence that the basal quiet Sun irradiances in lines formed at or below 1 MK are relatively unchanged across solar cycles and that irradiances during solar minimum conditions are similar for different cycles. As a result, it is reasonable to compare irradiances of the quiet Sun obtained over different periods, so we occasionally use the PEVE irradiances (obtained by fitting the original spectra) in conjunction with the quiet Sun irradiances of Manson (1972, hereafter M72) for the present benchmark.
M72 provided an excellent list of calibrated soft X-ray irradiances observed in quiet and active conditions in the 30–130 Å range. The quiet Sun spectrum was obtained on 1965 November 3, when the F10.7 flux was 80.6. The active Sun spectrum was obtained on 1967 August 8, when the F10.7 flux was 143.4, i.e. when the Sun was relatively active. The spectral resolution was moderate, about 0.23 Å (FWHM) for the quiet Sun, and 0.16 Å for the active Sun observation.
Behring et al. (1972, hereafter Be72) published a line list from a spectrum obtained with a spectrograph built at the Goddard Space Flight Center and flown on an Aerobee 150 rocket flight on 1969 May 16. On that day, the F10.7 flux was 159.4; i.e., the Sun was moderately active, as in the active Sun M72 observation. The instrument observed the entire Sun in the 60–385 Å region with high resolution (0.06 Å). To date, the Be72 spectrum is the best in terms of spectral resolution and wavelength accuracy for the strongest lines in the soft X-rays. Unfortunately, only approximate intensities were provided.
Malinovsky & Heroux (1973, hereafter MH73) presented an integrated-Sun spectrum covering the 50–300 Å range with a medium resolution (0.25 Å), taken with a grazing-incidence spectrometer flown on a rocket on 1969 April 4, when the F10.7 flux was 177.3, i.e. when the Sun was “active”. The spectrum was photometrically calibrated, and still, quite surprisingly, represents the best available spectrum in the EUV (150–300) Å range. The tables provided by MH73 were not complete, so we scanned their spectra to provide additional information. At various wavelengths, the MH73 resolution was better than M72. The spectra were wavelength and flux calibrated, matching the MH73 published intensities.
The MH73 irradiances were used by Malinovsky et al. (1980) to benchmark their Fe x atomic calculations. The results were discouraging, with the ratios of the soft X-ray vs. the EUV lines largely (by more than a factor of two) underpredicted by theory. The actual atomic calculations were incorrect, however, as pointed out in Del Zanna et al. (2012b). Also, it turns out that the line irradiances were incorrect. A simple direct comparison of the published irradiances by MH73 and M72 clearly shows a discrepancy of about a factor of two at various wavelengths. Various comparisons with the quiet Sun PEVE spectrum have been done, by taking the differences in spectral resolution into account. It is clear that the M72 has calibrated irradiances in excellent agreement with the PEVE ones in the 60–100 Å region, while the MH73 are largely overestimated, as shown in Fig. 1. The M72 irradiances were obtained by convolving the published intensities and putting them onto the PEVE resolution. The large difference in the MH73 irradiances have nothing to do with the fact that the Sun was more active, because they are present even in cool lines, which have similar irradiances independently of the solar conditions. We therefore recalibrated the MH73 spectrum to agree with the PEVE one. Obviously, in various spectral regions where “hot” lines are present, some disagreement is present. A few of these recalibrated MH73 line irradiances are used for the present benchmark.
The M72 irradiances above 100 Å are slowly decreasing when compared to the PEVE ones, an indication of an incorrect calibration towards the longer wavelengths. We therefore also recalibrated the M72 quiet Sun spectrum above 100 Å.
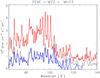 |
Fig. 1 A comparison between the soft X-ray irradiances of PEVE (black thin line), M72 (thicker blue), and MH73 (thicker red). |
Acton et al. (1985, hereafter A85) published a high-quality solar spectrum recorded on photographic film during a rocket flight, two minutes after the GOES X-ray peak emission of an M1-class flare. The spectrum was calibrated, and it provided accurate line intensities, although the sensitivity dropped above 77 Å. The spectral resolution was excellent, clearly resolving lines only 0.04 Å apart.
The identification of the iron soft X-rays n = 4 → n = 3 transitions started with the pioneering (and to date best) work by Edlén in the 1930s (see e.g. Edlén 1937a on Fe x). Edlén’s work was extended to the iron 3s23p2 4l (l = s,p,d,f) levels by the fundamental laboratory work of Fawcett et al. (1972, hereafter Fawcett). It is important to keep in mind that only lines with strong oscillator strengths were identified, that some identifications were tentative, and that several lines in the spectra were left unidentified. We have re-analysed some of Fawcett’s plates as part of a larger project to sort out the identifications in the soft X-ray spectrum. They have been used here for the benchmark. Each plate has been scanned, and the average spectra were obtained and wavelength-calibrated.
3. Summary of the main results
To assess how well experimental intensities compare with the predicted ones, we use the “emissivity ratio curves”, introduced in Paper I. These curves are obtained by dividing the observed intensities of the lines with their predicted emissivity as a function of the electron density (or temperature), calculated at a fixed temperature (or density), and normalised to 1. The crossing (or small spreading around 1) of the curves indicates agreement between observed and predicted line intensities.
The present benchmark is aimed at identifying the main transitions in some of the iron ions for which we have calculated new atomic data, however it was necessary to also benchmark a few other ions to assess blending in the iron lines.
3.1. Mg ix
The atomic data for Mg ix as calculated by Del Zanna et al. (2008) with the R-matrix method have been used here. These APAP data are available within CHIANTI version 7 (Dere et al. 1997; Landi et al. 2012). The identifications are from Söderqvist (1944).
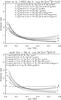 |
Fig. 2 Emissivity ratio curves relative to the main Mg ix lines and the solar flare (A85) and quiet Sun (M72, PEVE) observations. λob indicates the observed wavelength (Å), Iob indicates the observed intensity, sometimes reduced by the amount indicated. (bl) indicates a blend. |
A85 identified a relatively large number of Mg ix in the solar flare spectrum, however the benchmark has shown that several of those identifications are not correct. Figure 2 (top) shows the emissivity ratio curves relative to the main Mg ix lines and the A85 observation. The curves are plotted as a function of temperature because they have very little density sensitivity for the solar corona.
The 71.91 Å line cannot be due to Mg ix as reported by A85. By assuming that the strongest Mg ix transition at 72.30 Å is unblended, the 3–11 2s 2p 3P1–2s 3s 3S1 at 71.90 Å should only account for about 15% of the observed intensity, as shown in Fig. 2. Similarly, the 4–11 2s 2p 3P2–2s 3s 3S1 transition can only account for about 25% of the observed intensity at 72.02 Å by A85. Many of the Mg ix are blended at the M72 resolution, however the two strongest lines, the 72.30 and 77.73 Å lines, do not appear to be blended with Si viii and Na ix as listed in A85.
Excellent agreement between the M72 quiet Sun irradiances and the PEVE irradiance of the resonance 368 Å line is found (Fig. 2 below) for a very reasonable electron temperature around 1 MK. The PEVE measurement has been corrected for the Mg vii contribution, estimated from the SOHO/CDS irradiances where the lines are resolved (Del Zanna & Andretta 2011).
3.2. Mg x
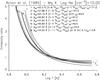 |
Fig. 3 Emissivity ratio curves relative to the main Mg x lines and the A85 solar flare observation. |
The excitation rates for Mg x as calculated by Zhang et al. (1990) and available within CHIANTI were used here. The identifications are from Feldman et al. (1970). The benchmark of this simple ion is straightforward. The identifications provided by A85 are confirmed, and excellent agreement between observed and predicted intensities found, as shown in Fig. 3. The curves are plotted as a function of temperature because they have no density sensitivity for the solar corona. Agreement within a few percent is obtained by assuming an isothermal temperature of log T[K] = 6.2. Only the weaker 1–11 44.05 Å line is blended with a stronger Si x.
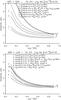 |
Fig. 4 Emissivity ratio curves relative to the main Fe xvi lines and the A85 solar flare observation. Top: using the Sampson et al. (1990) atomic data. Bottom: using the APAP data by Liang et al. (2009). |
3.3. Fe xvi
The identifications of the Fe xvi lines are from Edlén (1936b). The benchmark for this ion is straightforward. The A85 spectrum is excellent for benchmarking the main lines from this ion, because these lines are very strong and well resolved.
Sampson et al. (1990) performed relativistic DW calculations for this ion, and the data are available within CHIANTI. Cornille et al. (1997) later performed a similar DW calculation, and pointed out the possible use of the Fe xvi lines to measure electron temperatures. However, very high values (above log T [K] = 6.7) were obtained for the A85 observation. Various R-matrix calculations were done later. For example, Aggarwal & Keenan (2006) used the Dirac Atomic R-matrix Code (DARC). These data were used by Keenan et al. (2007) to show that reasonable agreement for the A85 data was present, although they did not discuss the temperature sensitivity of these lines. To show the large differences between DW and R-matrix calculations for this ion, we plot in Fig. 4 the emissivity ratio curves obtained with the DW Sampson et al. (1990) data and the latest R-matrix calculations (within APAP) by Liang et al. (2009). The curves in Fig. 4 are plotted as a function of temperature because they have no density sensitivity for the solar corona. The large discrepancies and high temperatures are obvious when the DW data are considered, as Fig. 4 (top) shows. On the other hand, relatively good agreement is obtained with the R-matrix calculations (Fig. 4 bottom). No significant temperature sensitivity is present.
3.4. Fe xv
The first identifications of the Fe xv lines are from Edlén (1936a). Fawcett identified several new transitions. Later, Cowan & Widing (1973) revised a few of Fawcett’s identifications and suggested a few tentative ones. Aside from Edlén (1936a) and Fawcett, accurate wavelengths are given by Kink et al. (1997), where a list of lines observed in laboratory spectra along the sequence is provided.
Various calculations for this ion exist in the literature. Bhatia et al. (1997) performed a scattering calculation for this ion complementing a DW run, and compared predicted line intensities with those observed by A85. As in the Fe xvi case, high electron temperatures (above log T [K] = 6.7) were obtained. Keenan et al. (2006) used the Aggarwal et al. (2003) R-matrix calculations to find relatively good agreement between predicted and observed A85 intensities at a much lower temperature (log T [K] = 6.3).
Here, we use the atomic data available within CHIANTI v.7. The atomic data for the main n = 4 levels are from the R-matrix calculations of Berrington et al. (2005), while those for the remaining n = 4 levels are from the DW calculations of Landi (2011). Table 1 lists the relative intensities of the brightest soft X-ray lines in Fe xv, at two densities, typical of the quiet solar corona and of laboratory spectra.
Relative intensities of the brightest soft X-ray lines in Fe xv.
The A85 solar flare spectrum is excellent for benchmarking the main lines from this ion, because these lines are strong and well resolved. The emissivity ratio curves relative to the main Fe xv lines and the A85 observation are shown in Fig. 5. As Keenan et al. (2006) pointed out, some line ratios are sensitive to the electron density, while others are to temperature. Among the lines considered here, lines No. 7 and 9 (70.05 and 56.17 Å) are the only ones sensitive to density, so the emissivity curves are plotted as a function of temperature, for a density appropiate to the A85 flare.
Excellent agreement is found for the four strongest lines, while the others appear blended. A significant discrepancy is present for the 63.97 Å line (No. 5 in Fig. 5), indicating a possible problem with the Landi (2011) data. Overall, the results are slightly different from those presented by Keenan et al. (2006). The strongest transition, the 5–37 3s 3p 1P1–3s 4s 1S0, was only tentatively identified by Cowan & Widing (1973), based on the fact that the 69.66 Å line becomes one of the strongest lines in the soft X-rays in solar flare conditions. The identification was confirmed by Bhatia et al. (1997). Kink et al. (1997) provides a wavelength of 69.661 Å. We also confirm the other tentative identification by Cowan & Widing (1973) for the line at 63.96 Å. For the other strongest lines, we confirm the identifications by Edlén (1936a) and Fawcett. Table 1 also provides several tentative identifications proposed here. Keenan et al. (2006) propose identifying the 82.76 Å line as the Fe xv 13–40 transition, however the CHIANTI model suggests that only 30% of the line is due to Fe xv.
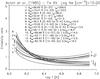 |
Fig. 5 Emissivity ratio curves relative to the main Fe xv lines and the A85 solar flare observation. |
3.5. Fe xiv
The atomic data for Fe xiv have recently been calculated by Liang et al. (2010) within the APAP network, and are used here. Table 2 lists the relative intensities of the brightest soft X-ray lines in Fe xiv, at two densities, typical of the quiet solar corona and of laboratory spectra. The identifications of the sof X-ray lines are from Fawcett. Most of the lines identified by Fawcett are very close (within 0.3 Å) to the target wavelengths. For example, the strongest decay from the 3s2 4s is the 2−101 3s2 3p 2P3/2–3s2 4s 2S1/2 transition, at a target wavelength of 70.56 Å, and identified by Fawcett with the 70.61 Å line. However, some are unidentified and some have large departures, indicating likely misidentifications.
Relative intensities of the brightest soft X-ray lines in Fe xiv.
The strongest soft X-ray line, previously not identified, is the main decay (6–136) to the 3s 3p2 2D3/2 from the 3s 3p 4s 2P1/2, which has a large population due to a strong forbidden core-excited transition from the ground state. The target wavelength for the 6–136 transition is 71.37 Å. The only strong line around 71.37 Å is the 71.91 Å line, previously incorrectly identified by A85 with a Mg ix transition as seen previously. Be72 wavelength is 71.919 Å. There is a strong line in Fawcett’s C53 plate at 71.94 Å. The A85 intensity of the 71.91 Å line (corrected for a 10% contribution from Mg ix as discussed previously) agrees with that of the 70.61 Å line, at log Ne [cm-3] = 9.8. Good agreement is also found with the 12–148 3s2 3d 2D5/2–3s2 4f 2F7/2 76.15 Å line as Fig. 6 shows. The intensities measured by M72 for the active Sun also confirm the identification. The second decay from the 3s 3p 4s 2P1/2 is the weaker (and blended) 8–136 transition, observed by M72 at 75.46 Å. Be72 reports a wavelength of 75.469 Å, in excellent agreement with what is predicted from the wavelength of the 6–136 line (75.471 Å).
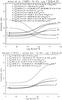 |
Fig. 6 Emissivity ratio curves relative to the main Fe xiv lines. Top: A85 solar flare observation. Bottom: M72 active Sun observation. |
The strongest decays from the 3s 3p 4d (see 4–179 and 5−184 in table) are tentatively identified here with the lines observed by A85 at 58.79 and 58.96 Å. The two main decays from the 3s2 4d (1–137 and 2–138) were identified by Edlén (1936a). If the identifications are correct, the first would be a self-blend and the second severely blended in the A85 spectrum.
The two main decays (11–122 and 12–125) from the 3s2 4p 2P1/2,3/2 levels were identified by Fawcett at 91.273 and 91.009 Å, respectively. The first is predicted to be the third strongest Fe xiv solar soft X-ray line. In the M72 and MH73 spectra of the quiet Sun, there are no strong lines at this wavelength. Furthermore, the 91.273 Å wavelength is at odds (2.7 Å) with the predicted one. The identification is therefore incorrect. The only line that matches the predicted intensity and wavelength well is the solar line at 93.61 Å, also observed in Fawcett’s plate C53 at exactly the same wavelength. Be72 lists a strong line at 93.618 Å. M72 clearly showed that this line becomes enhanced in active Sun conditions, which indicates that the line must be formed around 3 MK, the average temperature of active region cores, which is another argument in favour of the present identification as Fe xiv.
This line is of particular importance for the SDO AIA 94 Å band, as discussed below. Figure 6 shows that about 60% of the intensity observed by M72 in the active Sun can be accounted for by the Fe xiv 11–122 3s2 3d 2D3/2–3s2 4p 2P1/2 93.61 Å line. The decay to 3s 3p22D3/2 (6–122 line) was identified by Fawcett with a line at 78.765 Å. From the new wavelength of 93.61 Å, we obtain a wavelength of 80.50 Å for the 6–122 line. In both solar and laboratory plates, there is a very strong broad line around 80.50 Å, partly due to Fe xii (see below). The weaker decays from level 125 are identified with lines at 93.20 and 80.21 Å.
3.6. Fe xiii
The APAP atomic data for Fe xiii have been presented in Del Zanna & Storey (2012b). Here we use the most complete atomic model, with excitation rates calculated with the R-matrix for up to the n = 4 levels, and DW up to n = 6. Table 3 lists the relative intensities of the brightest soft X-ray lines in Fe xiii. The previous identifications are from Fawcett. Kastner et al. (1978) later provided some tentative identifications of a few more lines. Vilkas & Ishikawa (2004) present ab-initio atomic structure calculations, and suggest that in several cases misidentifications have occurred. The energies of the lower n = 3 levels have been carefully assessed in Del Zanna (2011) and are adopted here. Figure 7 shows the emissivity ratio curves relative to the A85 and M72 observations.
Relative intensities of the brightest soft X-ray lines in Fe xiii.
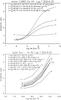 |
Fig. 7 Emissivity ratio curves relative to the main Fe xiii lines. Top: A85 solar flare observation. Bottom: M72 quiet Sun observation. |
The assessment of the Fe xiii soft X-ray lines has been difficult, so a more consistent picture will need to await further observations. Table 3 clearly shows that a number among the brightest lines were not identified. Fawcett’s identifications look sound in terms of wavelengths, however a few discrepancies are present in the solar spectra. If one, for example, assumes that the 3–344 3s2 3p23P2–3s2 3p 4d 3D3 62.975 Å identification is correct, the model predicts for the 1–341 3s2 3p23P0–3s2 3p 4d 3D1 62.353 Å line an intensity of 15 in the A85 spectrum. A85 reports a weak line at 62.36 Å, but does not provide an intensity. The 2–341 3s2 3p23P1–3s2 3p 4d 62.717 Å line would be blended with a stronger Mg ix line.
The strongest Fe xiii soft X-ray line is the 7–331 3s 3p3 3D1–3s 3p2 4s 3P0. This line is strong due to a large forbidden collision strength for the core-excited 3s2 3p2 3P0–3s 3p2 4s 3P0 transition. The second decay from the upper level to the 3s 3p3 3P1 (level 11) has about one fourth the intensity of the the 7−331 line and ought to be observable. The predicted wavelength for the 7−331 is around 76 Å, where there are three candidate lines, at 76.113, 76.507, and 76.867 Å in Be72. The A85 wavelengths are 76.12, 76.50, 76.80 Å, while M72 ones are 76.14, 76.51, 76.88 Å. The first line was identified by A85 as a blend of Fe xiv (see above) and the Fe xiii 4−221 3s2 3p21D2–3s2 3p 4s 1P1 observed by Fawcett at 76.117 Å. This identification is incorrect, given that the 4–221 is extremely weak in solar conditions. The A85 intensities can account for the 76.12 Å line being the 7−331, however in the M72 spectra the intensity of the 76.12 Å line is well accounted for by a self-blend of Fe xiv for both the active (as we have seen above) and quiet Sun spectrum, so this candidate line is discarded.
The second possibility is the 76.50 Å line. A85 identified it as an Fe xvi transition, however the Fe xvi line only contributes 25% of the observed intensity (see above). It is interesting to note that the 76.50 Å line is also observed well in quiet Sun conditions, which also confirms that this line cannot be due to Fe xvi, given that the quiet Sun does not have any significant Fe xvi emission. In the A85 spectrum, there is plenty of intensity to account for the 7−331 line. In the M72 quiet Sun spectrum, the line is weak. However, good agreement is found between the M72 intensity of this line and the main n = 3 → n = 3 EUV transition at 202 Å observed by PEVE, as Fig. 7 shows, which is a strong argument in support of this identification. The second decay (11–331) would fall at 79.07 Å, where a line is indeed observed. If this identification is correct, it means that all the other Fe xiii lines are severely blended.
The third possibility is the stronger (unidentified) line at 76.867 Å. However, in this case the second decay (11–331) would fall at 79.46 Å, where actually there is a line which can be attributed solely to Fe xii (see below), so in conclusion the 76.50 Å line is favoured. There is a strong line in Fawcett’s C53 plate at 76.51 Å.
Fawcett identified a few decays from the 3s2 3p 4p configuration, but not the two brightest ones in solar conditions, the decays from 3s2 3p 4p 3P0 (level 265) to 3s 3p33D1, 3s2 3p 3d 3P1 (levels 7,20). Fawcett’s energies for the 3s2 3p 4p levels suggest that the first decay should be the 84.72 Å line in the M72 spectrum, however the second would fall near 103.6 Å, where the intensity is solely due to the strongest Fe ix soft X-ray line (see below). A better choice are the two lines observed by Be72 at 85.470 and 103.928 Å. Their wavelengths exactly agree with the known energy difference between levels 7, 20, which is a strong argument for this identification (although their M72 intensities are too strong).
Relative intensities of the brightest soft X-ray lines in Fe xii.
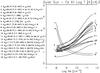 |
Fig. 8 Emissivity ratio curves relative to the main Fe xii lines and the M72 quiet Sun observation. |
Fawcett also identified a few decays from the 3s2 3p 4f configuration, but not the brightest ones for the solar corona, the 20–409 and 23–409 lines. They are identified here as the lines at 82.45 and 83.24 Å in the M72 spectrum. The first is blended with an Fe ix line, and the second is also blended. Be72 provides the 82.425 and 83.221 Å wavelengths, in excellent agreement with the known energies of levels 20, 23 (providing 1 708 166 and 1 708 125 cm-1 as energies for the 3s2 3p 4f 3F2).
Relative intensities of the brightest soft X-ray lines in Fe xi.
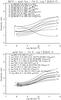 |
Fig. 9 Emissivity ratio curves relative to the main Fe xi lines. Top: Be72 quiet Sun observation. Bottom: quiet Sun irradiances from M72, MH73 and PEVE. |
3.7. Fe xii
The APAP atomic data for Fe xii have been presented in Del Zanna et al. (2012a). We use the most complete atomic model, with excitation rates calculated with the R-matrix method for up to the n = 4 levels, and DW up to n = 6. Table 4 lists the relative intensities of the brightest soft X-ray lines in Fe xii. Previous identifications are from Fawcett. The energies of the lower n = 3 levels were carefully assessed in Del Zanna & Mason (2005) and are adopted here. Figure 8 shows the emissivity ratio curves relative to the M72 observations.
As we have seen for the other ions, the core-excited 3s2 3p3 4S3/2–3s 3p3 4s 4S3/2 is a strong forbidden transition, which provides a large population to the upper level (467), which in turn decays to levels 6,7,8,27,29. The first three decays are strong; indeed, as shown in Table 4 the first two are the strongest soft X-ray lines from this ion.
Some decays from the 3s2 3p2 4s were identified by Fawcett. The differences between observed and predicted wavelengths are about 1.2 Å. If similar differences were applied to the 3s 3p3 4s configuration, we obtained a predicted wavelength for the strongest 6–467 transition of 82 Å. There are a few candidate lines in both solar and laboratory spectra, however the strongest one is observed by M72 at 82.75 Å. Fawcett’s plate C53 also has a strong broad line around 82.74 Å. Be72 provided a wavelength of 82.672 Å for the same line. Based on this, the second and third decays (7,8–467) are predicted to be at 83.336 and 83.635 Å, in excellent agreement with the lines observed by Be72 at 83.336 and 83.631 Å. This is an unlikely coincidence and confirms the present identification. The 83.336 Å at the M72 resolution is blended with an Fe ix transition (see below). In Fawcett plate C53 there is a pseudo-continuum of transitions between 83.3 and 83.7 Å, where these two decays are.
The next strongest transitions are the decays from the 3s2 3p2 4p 4S3/2 (level 390) to levels 6, 7,8, 29, 27. The level is relatively pure (78%). Fawcett identified a few 3s2 3p2 4p levels, and the difference between predicted and observed wavelengths is around 1.4 Å. The strongest decay (6–390) should then fall around 90.4 Å. There is a weak line at 90.4 Å in M72 (90.503 Å in Be72), but the corresponding decays to levels 7,8 would then be at 91.30 and 91.66 Å (using Be72 wavelength). There is no line at 91.30 Å. Of all the lines around 90.4 there is only one with the appropriate wavelength, observed by Be72 at 91.004 Å. This wavelength predicts decays to levels 7,8 at 91.809 and 92.172 Å. Be72 observed two lines at 91.808 and 92.178 Å, an unlikely coincidence, although both lines would have to be blended, the first one with Ni x and Fe xi. The difference between observed and predicted wavelength with the new identifications is 2 Å. The weaker decays to levels 29,27 would fall at 116.76 and 116.18 Å, and would be blended with other stronger transitions.
One question then naturally arises: are the other identifications of the 3s2 3p2 4p levels correct? The solar spectra cannot resolve this issue. The best solar spectrum at the wavelengths of these decays is the MH73, but the spectral resolution is not enough. Be72 does not list the (weak) lines observed by MH73. The Fawcett plate does provide viable alternatives for all the main transitions, with observed wavelengths about 2 Å away from the predicted ones, so it is possible that all previous identifications are incorrect.
The M72 intensities are in excellent agreement with predictions and the present identifications, for the three strongest decays from the 3s 3p3 4s 4S3/2 (6–467), 3s2 3p2 4p 4S3/2 (6–390), and 3p2 4s 4P5/2 (1–288), as Fig. 8 shows. The intensity of the self-blend (at the M72 resolution) of the 3s2 3p2 4d 4F5/2,4P3/2 decays to the ground state is also in excellent agreement. There is a discrepancy with the EUV lines as measured with PEVE, however (cf. the 192.4 Å in Fig. 8). This discrepancy could in part be due to the lower solar activity during 2008, but also in part due to residual blending in all the Fe xii lines.
Finally, a few remarks about some weaker lines. The 80.50 Å strong line in Fawcett C53 spectrum was identified as a self-blend of Fe xii lines; however, as we have seen above, we predict a new strong Fe xiv transition at this wavelength. The M72 intensity supports this, given that the 1–272 transition is predicted to contribute only about 30% to the intensity of the observed line in the solar spectrum (60% was estimated to be due to Fe xiv).
The model predicts two weak decays from the 3s2 3p2 4p 2D5/2 (410) level. The energy splitting for nearby 3s2 3p2 4p levels suggests that the two decays should be the lines at 120.3, 93.4 Å, observed in the MH73 and Fawcett’s C53 plate (a possible alternative would be 121.1, 93.8 Å). M72 also observed a line at 93.46 Å, listed as blended. The MH73 intensity has approximately the right intensity. We can then estimate the intensity of the 10–410 line to be about 1 × 10⁶ phot cm-2 s-1, i.e. about half of the M72 intensity.
3.8. Fe xi
The APAP atomic data for Fe xi were presented in Del Zanna & Storey (2012a). We use here the most complete atomic model, with excitation rates calculated with the R-matrix method for up to the n = 4 levels, and DW up to n = 6. Table 5 lists the relative intensities of the brightest soft X-ray lines in Fe xi. The previous identifications are from Edlén (1937b) and Fawcett. The energies of the lower n = 3 levels were carefully assessed in Del Zanna (2010) and are adopted here.
Figure 9 shows the emissivity ratio curves relative to the quiet Sun observations. As in the Fe xiv, Fe xiii, and Fe xii case, the strongest soft X-ray line is the unidentified dipole-allowed decay (6–596) from a level (3s 3p4 4s 3P2) that is core-excited via a strong forbidden transition form the ground state. On the basis of the predicted vs. observed wavelengths of the few decays from the 3s2 3p3 4s identified by Fawcett, we expect the 6−596 line to fall around 88 Å. There is indeed a strong line at 88.082 Å in Be72 (88.1 Å in M72), however this is a Ne viii transition. Furthermore, the next decay from level 596 is the 7−596, predicted to be about 1/4 the intensity of the strongest line. The 88.082 Å wavelength would predict the 7−596 to fall at 88.834 Å where no line is observed. The next strongest line is the unidentified 88.933 Å in Be72, which predicts a wavelength for the 7−596 line of 89.699 Å. Indeed in Be72 there is a line of the right intensity (see Fig. 9 top) at 89.703 Å, which would be a very unlikely coincidence. The 6–596 transition is therefore identified with the 88.933 Å line.
Relative intensities of the brightest soft X-ray lines in Fe x.
The strongest decays from the 3s2 3p3 4s identified by Fawcett are the 86.765, 89.178 Å lines. These and others among the strongest transitions are severely blended in M72, but fall within a few Å, so it is reasonable to use the Be72 approximate counts to check the relative intensities of these lines. Figure 9 (top) shows that the intensity of the 86.772 Å is in good agreement with that of the 6–596 as we have identified it, while the 89.185 Å line would be blended. Other lines such as the 2–265 at 90.17 Å, 1–289 at 87.018 Å, and 4-295 at 89.087 Å, also appear to be blended.
Some of those among the brightest lines for this ion are from the 3s2 3p3 4p, in particular the 6–454, the second strongest transition. Fawcett identified a few transitions in the C53 plate, but not the strongest ones in solar conditions. Fawcett’s identifications suggest that the 6–454 transition should fall around 99.4 Å, however there are no strong lines there. The strongest nearby line is the previously unidentified 100.575 Å one. Its Be72 intensity is in remarkable agreement with the predicted one. The upper level has a series of decays, the main ones to levels 42, and 7, with predicted wavelengths of 138.215 and 101.556 Å. Be72 indeed has a line at 101.559 Å (probably blended), and the MH73 spectrum has a line at 138.2 Å with the right intensity (see Fig. 9). The new energy for level 454 (3s2 3p3 4p 3P2) is significantly (by 11000 cm-1) at odds with those of the levels identified by Fawcett (in terms of energy difference between observed and predicted). For each of the lines identified by Fawcett, there are alternative candidates in the same C53 plate that have similar energy differences to the 3s2 3p3 4p 3P2. Some of these alternative identifications are listed in Table 5.
Fawcett identified a few amongst the decays from the 3s2 3p3 4f, some only tentatively. The two strongest lines in solar conditions were not identified. Based on the energy differences of the identified ones, the two 16–749 and 42–813 transitions are tentatively identified with the 92.18 and 102.10 Å lines, observed in the solar spectra.
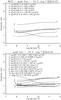 |
Fig. 10 Emissivity ratio curves relative to the main Fe x lines in the quiet Sun. Top: Be72. Bottom: from the M72, MH73, and PEVE irradiances. |
The Be72 spectrum helps in accounting for the various blends in the lower-resolution M72 spectrum, and good agreement is also found there, as Fig. 9 (bottom) shows. Moreover, the quiet-Sun PEVE intensity of the strongest EUV line is in excellent agreement as well, further confirming the atomic calculations and the identifications. This is remarkable.
3.9. Fe x
The atomic data for Fe x were presented and discussed in detail in Del Zanna et al. (2012b). We use here the most complete atomic model, with excitation rates calculated with the R-matrix for up to n = 4 and DW up to n = 6. Table 6 lists the relative intensities of the brightest soft X-ray lines in Fe x. The previous identifications are from Edlén (1937a) and Fawcett. The energies of the lower n = 3 levels have been carefully assessed in Paper I and are adopted here.
Figure 10 shows the emissivity ratio curves relative to the Be72 and M72 observations. For some of the weaker lines, the intensities obtained from the MH73 spectrum are used. There is good overall agreement among the main decays from the 3s2 3p4 4s (identified by Edlén 1937a), with the exception of the 97.122 Å line, which appears to be blended, even at the Be72 resolution. The main decay from the 3s 3p5 4s 2P3/2, the strongest line, was tentatively identified in Del Zanna et al. (2012b) with the 96.0 Å transition.
Relative intensities of a few soft X-ray lines in Fe ix.
The Be72 intensity for this line is a bit low, however there are no other strong lines in the vicinity. The 96.0+96.1 Å blend, observed by M72, has a calibrated intensity in excellent agreement (within 30%) with the quiet Sun PEVE value for the EUV 174.5 Å line, as shown in Fig. 10. The 94.0 Å line also has an excellent agreement, if one assigns 30% of the M72 intensity to the 93.838 Å (unidentified) line, as observed by Be72. This comparison confirms the accuracy (at least to about 30%) of the new atomic calculations.
Fawcett identified a few decays from the 3s2 3p4 4p. Based on this, we tentatively identify the 3–302 transition with a weak line in the M72 spectrum at 109.52 Å. The 27–302 transition would be at 151.42 Å, where there is a weak line in the MH73 spectrum. An alternative for the 3–302 transition would be the 108.53 Å line.
3.10. Fe ix
The atomic data for Fe ix have been discussed in O’Dwyer et al. (2012), where the detailed list of the strongest lines can be found. The excitation rates for the 3s2 3p5 4s and 3s2 3p5 4p levels are from Storey et al. (2002), the rest from O’Dwyer et al. (2012). The previous identifications are from Kruger et al. (1937, the two strong decays from the 4s levels), Alexander et al. (1965, four decays from the 4d and 5s levels), and Wagner & House (1971, 12 transitions within the 3p5 3d–3p5 4f array).
Figure 11 shows the emissivity ratio curves relative to the M72 observations. There is excellent (within ± 20%) agreement amongst all the brightest soft X-ray lines, and the EUV 171 Å PEVE quiet Sun irradiance. The weaker lines are blended at the M72 resolution, as noted in Fig. 11.
A few 3d–5f transitions were tentatively identified in O’Dwyer et al. (2012). The strongest one is the 3s2 3p5 3d 3F4–3s2 3p5 5f 3G5 line, which was predicted to be at 92. Å. The intensity of this line does not agree well with the calibrated M72 spectrum, however, so it is suggested that this line blends the stronger solar line at 91.81 Å. A few new tentative identifications are proposed here in Table 7.
3.11. An overall comparison
The new atomic models provide intensities for a few million spectral lines in the soft X-rays. Given that this spectral region is inherently overcrowded, we have also computed spectra to be compared to the observed ones, to see how much blending occurs from this forest of lines.
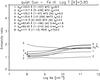 |
Fig. 11 Emissivity ratio curves relative to the main Fe ix lines for the quiet Sun. |
We have taken the quiet Sun M72 spectrum and calibrated it in wavelength, using the best known isolated and strong lines. We have then flux-calibrated it, by comparing it with the M72 published intensities and the PEVE ones. The resulting spectrum is shown in Fig. 12 (black).
We then adopted the set of “best” energies as calculated for each of the iron ions. They were obtained by linear interpolation of the few known energies with respect to the target energies. We added the identifications of the strongest lines provided here. We merged these datasets with those for all the other ions not discussed here, using CHIANTI v.7 (Landi et al. 2012), and computed line emissivities for quiet Sun conditions, at a constant electron density of 1.0 × 10⁸ [cm-3].
To obtain quiet Sun irradiances, we folded the line emissivities with a quiet Sun differential emission measure (DEM) obtained from SOHO/CDS radiances not far from the limb by Andretta et al. (2003), assuming photospheric abundances. For the forward modelling, we have adopted the new CHIANTI ion fractions, and a recent set of photospheric abundances by Asplund et al. (2009). We then roughly converted radiances into irradiances by neglecting limb-brightening and off-limb contributions. A proper treatment would just scale the absolute values of the irradiances. The irradiances were then folded with Gaussian line profiles to match the M72 observed spectra, and put onto a wavelength grid with a bin size similar to the M72 one. The resulting spectra are also shown in Fig. 12 (red). The agreement is remarkable. The same figure also shows (in blue) the location and intensities of the main lines contributing to the calculated spectra. This clearly shows, as we knew, that the majority of the lines at the M72 resolution are blends of many transitions. The most significant ones are labelled.
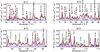 |
Fig. 12 Quiet Sun spectrum from M72, recalibrated (thick black), with overplotted a theoretical spectrum (thin red). The locations and intensities of the main lines are shown (blue vertical lines). |
The 80–106 Å spectral region is dominated by iron ions, indeed Fig. 13 (top) shows the improvement with the new atomic data, compared to CHIANTI v.7. Figure 12 shows that a significant fraction of flux is still missing, being probably due to a range of other ions that are emitting at these wavelengths. The 60–80 Å spectral region in the quiet Sun is dominated by a range of non-iron ions instead. Relatively good agreement in terms of wavelengths and intensities is present, with two notable exceptions, several lines from Si viii and Si ix around 61 and 68 Å.
Different source regions of the solar corona are going to produce very different spectra. This is an additional complication for the benchmark and for the analysis of solar spectra. To show how different they are, an average active region spectrum has been obtained from a DEM based on the SERTS-89 observation (Thomas & Neupert 1994; Del Zanna 1999). This is shown in Fig. 13 (bottom, AR). To assess the contributions due to the cooler transition-region (T ≤ 1 MK) lines, a spectrum of the base of an active region loop (region B in Del Zanna et al. 2011) has been calculated, and is also shown in Fig. 13 (bottom, TRBR).
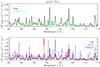 |
Fig. 13 Top: quiet Sun theoretical spectra, from the present atomic data and identifications, compared to CHIANTI v.7. Bottom: theoretical spectra for the quiet Sun (QS, thickest black), an active region (AR, reduced by a factor of 5, thick red), and the base of a loop (TRBR, reduced by a factor of 5, blue thin). |
3.12. The SDO AIA 94 Å band
The SDO AIA 94 Å band has been the subject of various studies, to try to resolve the discrepancies in terms of atomic data (Del Zanna et al. 2011; O’Dwyer et al. 2012; Foster & Testa 2011; Testa et al. 2012). To see how the new atomic data and identifications affect the SDO AIA 94 Å band, the predicted quiet Sun spectrum has been folded with the AIA effective area, to provide estimated count rates per AIA pixel. They are shown in Fig. 14 (black thin spectrum). For comparison, a normalised M72 spectrum is overplotted (thick black spectrum), as well as what is calculated with the previous CHIANTI v7 (green dashed), which had, for Fe x, incorrect atomic data. The plot shows that, for the quiet Sun, some missing flux is still present, in the blue wing of the dominant contribution from Fe x. This was expected. Be72 reports four strong lines at 93.618, 93.838, 93.933, and 94.016 Å. The last line is only 4 mÅ longwards of Edlen’s measurement of 94.012 for the Fe x line. The 93.933 Å has the same wavelength as the strong Fe xviii line at 93.932 Å (Del Zanna 2006), and it is likely that this ion indeed provides the observed counts. The 93.618 Å has been identified here as Fe xiv (blended with Fe viii), but the 93.838 still remains unidentified. There is a line also present in Fawcett C53 plate at the same wavelength, which could be a coincidence or the same transition due to an iron ion. Further blending of weaker lines is possible.
The atomic data for a range of ions that produce lines observed in the laboratory or predicted to fall around these wavelengths were assessed, but no significant missing flux in solar conditions has yet been found. For example, strong lines from Mg vii and Mg viii were observed at 94.043 Å. A few transitions from Al v are also present, however the APAP atomic data (Witthoeft et al. 2007) indicate that they would be weak. There is an O vi 2s–9p observed at 93.84 Å, however even the presence of the 2s–8p and 2s–7p transitions is dubious. New atomic calculations for some ions are in progress to clarify this.
The newly identified Fe xiv at 93.61 Å does provide a significant contribution to the 94 Å band even for the quiet Sun. This becomes even more significant in active regions, as shown in Fig. 14 (AR, reduced by a factor of 20 and obtained from the SERTS-89 observation). The dominant count rates in the band are originating from Fe xiv and the Fe xviii line at 93.932 Å.
To assess the contributions due to the cooler Fe viii and Fe ix lines, the spectrum of the base of an active region loop (see above) is also shown in Fig. 14 (blue, reduced by a factor of 3). Indeed in this particular case, the Fe viii transitions (O’Dwyer et al. 2012) produce a significant contribution to this band.
Del Zanna et al. (2011) presented a detailed comparison of SDO AIA and Hinode/EIS spectra, showing that indeed there are for the 94 Å band, aside from the 1 MK Fe x contribution, at least two additional components. One is a hot component, which we identify with Fe xiv, and one is a cooler component, which we identify with Fe viii.
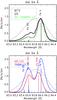 |
Fig. 14 SDO AIA 94 Å simulated count rates, obtained for the quiet Sun (QS), an active region core (AR, reduced by a factor of 20) and a loop base (TRBR, reduced by a factor of 3). The M72 quiet Sun spectrum (normalised) is also shown, as is the quiet Sun spectrum obtained from CHIANTI v7. The AIA effective area (normalised) is shown as a dashed line. |
4. Conclusions
This paper is the first benchmark for the soft X-ray lines. It is a summary of almost two years of work on the calculations and identifications of the soft X-ray lines due to n = 4 → n = 3 transitions of the main iron ions. Both large-scale R-matrix and distorted wave scattering calculations turned out to be needed to account for resonance enhancements in the excitation rates for the n = 4 levels and for cascading from higher levels.
The identification proved very difficult, owing to the lack of high-resolution, well-calibrated spectra, the fact that the soft X-rays are notoriously packed with a large number of transitions from a range of ions, and the large difference in laboratory and solar spectra.
The strongest iron transitions are all finally identified here. Very good agreement between the soft-Xray (n = 4 → n = 3) and EUV (n = 3 → n = 3) irradiances of the strongest lines is found for the first time, confirming the reliability of the new calculations.
In several cases, various discrepancies in the previous identifications have been found, and many tentative (new or revised) identifications have been proposed. Better experimental data and more atomic calculations on a range of other ions will be needed to confirm them. Some calculations for other ions that produce strong lines in the soft X-rays are already in progress.
With regard to the SDO AIA 94 Å band, good progress has been made, with a new important identification of a strong Fe xiv line at 93.61 Å, and the new calculations for Fe x, Fe ix, and Fe viii. At least one residual transition still need to be identified though.
The new large amount of APAP atomic data will be made available through the CHIANTI database; however, this will require a new format and a new way of handling them. Work is in progress in this direction.
Acknowledgments
I acknowledge STFC (UK) support from the Advanced Fellowship programme and the APAP network. B. C. Fawcett is thanked for his contribution by helping in selecting some of his best original plates and for the continuous encouragement over the years. P. J. Storey and H. E. Mason are also thanked for useful discussions.
References
- Acton, L. W., Bruner, M. E., Brown, W. A., et al. 1985, ApJ, 291, 865 [NASA ADS] [CrossRef] [Google Scholar]
- Aggarwal, K. M., & Keenan, F. P. 2006, A&A, 450, 1249 [NASA ADS] [CrossRef] [EDP Sciences] [Google Scholar]
- Aggarwal, K. M., Keenan, F. P., & Msezane, A. Z. 2003, A&A, 410, 349 [NASA ADS] [CrossRef] [EDP Sciences] [Google Scholar]
- Alexander, E., Feldman, U., & Fraenkel, B. S. 1965, J. Opt. Soc. Am. (1917–1983), 55, 650 [NASA ADS] [CrossRef] [Google Scholar]
- Andretta, V., Del Zanna, G., & Jordan, S. D. 2003, A&A, 400, 737 [NASA ADS] [CrossRef] [EDP Sciences] [Google Scholar]
- Asplund, M., Grevesse, N., Sauval, A. J., & Scott, P. 2009, ARA&A, 47, 481 [NASA ADS] [CrossRef] [Google Scholar]
- Behring, W. E., Cohen, L., & Feldman, U. 1972, ApJ, 175, 493 [NASA ADS] [CrossRef] [Google Scholar]
- Berrington, K. A., Ballance, C. P., Griffin, D. C., & Badnell, N. R. 2005, J. Phys. B Atom. Molecul. Phys., 38, 1667 [Google Scholar]
- Bhatia, A. K., Mason, H. E., & Blancard, C. 1997, Atomic Data and Nuclear Data Tables, 66, 83 [NASA ADS] [CrossRef] [Google Scholar]
- Chamberlin, P. C., Woods, T. N., Crotser, D. A., et al. 2009, Geophys. Res. Lett., 36, 5102 [NASA ADS] [CrossRef] [Google Scholar]
- Cornille, M., Dubau, J., Mason, H. E., Blancard, C., & Brown, W. A. 1997, A&A, 320, 333 [NASA ADS] [Google Scholar]
- Cowan, R. D., & Widing, K. G. 1973, ApJ, 180, 285 [NASA ADS] [CrossRef] [Google Scholar]
- Del Zanna, G. 1999, Ph.D. Thesis, Univ. of Central Lancashire, UK [Google Scholar]
- Del Zanna, G. 2006, A&A, 459, 307 [NASA ADS] [CrossRef] [EDP Sciences] [Google Scholar]
- Del Zanna, G. 2010, A&A, 514, A41 [NASA ADS] [CrossRef] [EDP Sciences] [Google Scholar]
- Del Zanna, G. 2011, A&A, 533, A12 [NASA ADS] [CrossRef] [EDP Sciences] [Google Scholar]
- Del Zanna, G., & Andretta, V. 2011, A&A, 528, A139 [NASA ADS] [CrossRef] [EDP Sciences] [Google Scholar]
- Del Zanna, G., & Mason, H. E. 2005, A&A, 433, 731 [NASA ADS] [CrossRef] [EDP Sciences] [Google Scholar]
- Del Zanna, G., & Storey, P. J. 2012a, A&A, submitted [Google Scholar]
- Del Zanna, G., & Storey, P. J. 2012b, A&A, 543, A144 [NASA ADS] [CrossRef] [EDP Sciences] [Google Scholar]
- Del Zanna, G., Berrington, K. A., & Mason, H. E. 2004, A&A, 422, 731 [NASA ADS] [CrossRef] [EDP Sciences] [Google Scholar]
- Del Zanna, G., Rozum, I., & Badnell, N. 2008, A&A, 487, 1203 [NASA ADS] [CrossRef] [EDP Sciences] [Google Scholar]
- Del Zanna, G., Andretta, V., Chamberlin, P. C., Woods, T. N., & Thompson, W. T. 2010, A&A, 518, A49 [NASA ADS] [CrossRef] [EDP Sciences] [Google Scholar]
- Del Zanna, G., O’Dwyer, B., & Mason, H. E. 2011, A&A, 535, A46 [NASA ADS] [CrossRef] [EDP Sciences] [Google Scholar]
- Del Zanna, G., Storey, P. J., Badnell, N. R., & Mason, H. E. 2012a, A&A, 543, A139 [NASA ADS] [CrossRef] [EDP Sciences] [Google Scholar]
- Del Zanna, G., Storey, P. J., Badnell, N. R., & Mason, H. E. 2012b, A&A, 541, A90 [NASA ADS] [CrossRef] [EDP Sciences] [Google Scholar]
- Dere, K. P., Landi, E., Mason, H. E., Monsignori Fossi, B. C., & Young, P. R. 1997, A&AS, 125, 149 [NASA ADS] [CrossRef] [EDP Sciences] [Google Scholar]
- Dere, K. P., Landi, E., Young, P. R., et al. 2009, A&A, 498, 915 [NASA ADS] [CrossRef] [EDP Sciences] [Google Scholar]
- Edlén, B. 1936a, Z. Phys., 103, 536 [Google Scholar]
- Edlén, B. 1936b, Z. Phys., 100, 621 [Google Scholar]
- Edlén, B. 1937a, Z. Astrophys., 104, 407 [Google Scholar]
- Edlén, B. 1937b, Z. Astrophys., 104, 188 [Google Scholar]
- Fawcett, B. C., Kononov, E. Y., Hayes, R. W., & Cowan, R. D. 1972, J. Phys. B Atom. Molecul. Phys., 5, 1255 [Google Scholar]
- Feldman, U., Cohen, L., & Behring, W. 1970, J. Opt. Soc. Am. (1917–1983), 60, 891 [NASA ADS] [CrossRef] [Google Scholar]
- Foster, A. R., & Testa, P. 2011, ApJ, 740, L52 [NASA ADS] [CrossRef] [Google Scholar]
- Kastner, S. O., Swartz, M., Bhatia, A. K., & Lapides, J. 1978, J. Opt. Soc. Am., 68, 1558 [NASA ADS] [CrossRef] [Google Scholar]
- Keenan, F. P., Drake, J. J., Chung, S., et al. 2006, ApJ, 645, 597 [NASA ADS] [CrossRef] [Google Scholar]
- Keenan, F. P., Drake, J. J., & Aggarwal, K. M. 2007, MNRAS, 381, 1727 [NASA ADS] [CrossRef] [Google Scholar]
- Kink, I., Tunklev, M., & Litzén, U. 1997, J. Opt. Soc. Am. B Opt. Phys., 14, 722 [NASA ADS] [CrossRef] [Google Scholar]
- Kruger, P. G., Weissberg, S. G., & Phillips, L. W. 1937, Phys. Rev., 51, 1090 [NASA ADS] [CrossRef] [Google Scholar]
- Landi, E. 2011, Atomic Data and Nuclear Data Tables, 97, 587 [Google Scholar]
- Landi, E., Del Zanna, G., Young, P. R., Dere, K. P., & Mason, H. E. 2012, ApJ, 744, 99 [NASA ADS] [CrossRef] [Google Scholar]
- Lemen, J. R., Title, A. M., Akin, D. J., et al. 2012, Sol. Phys., 275, 17 [NASA ADS] [CrossRef] [Google Scholar]
- Lepson, J. K., Beiersdorfer, P., Brown, G. V., et al. 2002, ApJ, 578, 648 [NASA ADS] [CrossRef] [Google Scholar]
- Liang, G. Y., & Zhao, G. 2010, MNRAS, 405, 1987 [Google Scholar]
- Liang, G. Y., Whiteford, A. D., & Badnell, N. R. 2009, A&A, 500, 1263 [NASA ADS] [CrossRef] [EDP Sciences] [Google Scholar]
- Liang, G. Y., Badnell, N. R., Crespo López-Urrutia, J. R., et al. 2010, ApJS, 190, 322 [NASA ADS] [CrossRef] [Google Scholar]
- Malinovsky, L., & Heroux, M. 1973, ApJ, 181, 1009 [NASA ADS] [CrossRef] [Google Scholar]
- Malinovsky, M., Dubau, J., & Sahal-Brechot, S. 1980, ApJ, 235, 665 [NASA ADS] [CrossRef] [Google Scholar]
- Manson, J. E. 1972, Sol. Phys., 27, 107 [NASA ADS] [CrossRef] [Google Scholar]
- O’Dwyer, B., Del Zanna, G., Badnell, N. R., Mason, H. E., & Storey, P. J. 2012, A&A, 537, A22 [NASA ADS] [CrossRef] [EDP Sciences] [Google Scholar]
- Sampson, D. H., Zhang, H. L., & Fontes, C. J. 1990, Atomic Data and Nuclear Data Tables, 44, 209 [Google Scholar]
- Söderqvist, J. 1944, J. Ark. Mat. Astron. Fysik., 30 [Google Scholar]
- Storey, P. J., Zeippen, C. J., & Le Dourneuf, M. 2002, A&A, 394, 753 [NASA ADS] [CrossRef] [EDP Sciences] [Google Scholar]
- Testa, P., Drake, J. J., & Landi, E. 2012, ApJ, 745, 111 [NASA ADS] [CrossRef] [Google Scholar]
- Thomas, R. J., & Neupert, W. M. 1994, ApJS, 91, 461 [NASA ADS] [CrossRef] [Google Scholar]
- Vilkas, M. J., & Ishikawa, Y. 2004, Phys. Rev. A, 69, 062503 [NASA ADS] [CrossRef] [Google Scholar]
- Wagner, W. J., & House, L. L. 1971, ApJ, 166, 683 [NASA ADS] [CrossRef] [Google Scholar]
- Witthoeft, M. C., Whiteford, A. D., & Badnell, N. R. 2007, J. Phys. B Atom. Molecul. Phys., 40, 2969 [Google Scholar]
- Woods, T. N., Chamberlin, P. C., Harder, J. W., et al. 2009, Geophys. Res. Lett., 36, 1101 [Google Scholar]
- Woods, T. N., Eparvier, F. G., Hock, R., et al. 2012, Sol. Phys., 275, 115 [Google Scholar]
- Zhang, H. L., Sampson, D. H., & Fontes, C. J. 1990, Atomic Data and Nuclear Data Tables, 44, 31 [NASA ADS] [CrossRef] [Google Scholar]
All Tables
All Figures
|
Fig. 1 A comparison between the soft X-ray irradiances of PEVE (black thin line), M72 (thicker blue), and MH73 (thicker red). |
| In the text | |
|
Fig. 2 Emissivity ratio curves relative to the main Mg ix lines and the solar flare (A85) and quiet Sun (M72, PEVE) observations. λob indicates the observed wavelength (Å), Iob indicates the observed intensity, sometimes reduced by the amount indicated. (bl) indicates a blend. |
| In the text | |
|
Fig. 3 Emissivity ratio curves relative to the main Mg x lines and the A85 solar flare observation. |
| In the text | |
|
Fig. 4 Emissivity ratio curves relative to the main Fe xvi lines and the A85 solar flare observation. Top: using the Sampson et al. (1990) atomic data. Bottom: using the APAP data by Liang et al. (2009). |
| In the text | |
|
Fig. 5 Emissivity ratio curves relative to the main Fe xv lines and the A85 solar flare observation. |
| In the text | |
|
Fig. 6 Emissivity ratio curves relative to the main Fe xiv lines. Top: A85 solar flare observation. Bottom: M72 active Sun observation. |
| In the text | |
|
Fig. 7 Emissivity ratio curves relative to the main Fe xiii lines. Top: A85 solar flare observation. Bottom: M72 quiet Sun observation. |
| In the text | |
|
Fig. 8 Emissivity ratio curves relative to the main Fe xii lines and the M72 quiet Sun observation. |
| In the text | |
|
Fig. 9 Emissivity ratio curves relative to the main Fe xi lines. Top: Be72 quiet Sun observation. Bottom: quiet Sun irradiances from M72, MH73 and PEVE. |
| In the text | |
|
Fig. 10 Emissivity ratio curves relative to the main Fe x lines in the quiet Sun. Top: Be72. Bottom: from the M72, MH73, and PEVE irradiances. |
| In the text | |
|
Fig. 11 Emissivity ratio curves relative to the main Fe ix lines for the quiet Sun. |
| In the text | |
|
Fig. 12 Quiet Sun spectrum from M72, recalibrated (thick black), with overplotted a theoretical spectrum (thin red). The locations and intensities of the main lines are shown (blue vertical lines). |
| In the text | |
|
Fig. 13 Top: quiet Sun theoretical spectra, from the present atomic data and identifications, compared to CHIANTI v.7. Bottom: theoretical spectra for the quiet Sun (QS, thickest black), an active region (AR, reduced by a factor of 5, thick red), and the base of a loop (TRBR, reduced by a factor of 5, blue thin). |
| In the text | |
|
Fig. 14 SDO AIA 94 Å simulated count rates, obtained for the quiet Sun (QS), an active region core (AR, reduced by a factor of 20) and a loop base (TRBR, reduced by a factor of 3). The M72 quiet Sun spectrum (normalised) is also shown, as is the quiet Sun spectrum obtained from CHIANTI v7. The AIA effective area (normalised) is shown as a dashed line. |
| In the text | |
Current usage metrics show cumulative count of Article Views (full-text article views including HTML views, PDF and ePub downloads, according to the available data) and Abstracts Views on Vision4Press platform.
Data correspond to usage on the plateform after 2015. The current usage metrics is available 48-96 hours after online publication and is updated daily on week days.
Initial download of the metrics may take a while.