Free Access
Fig. 2
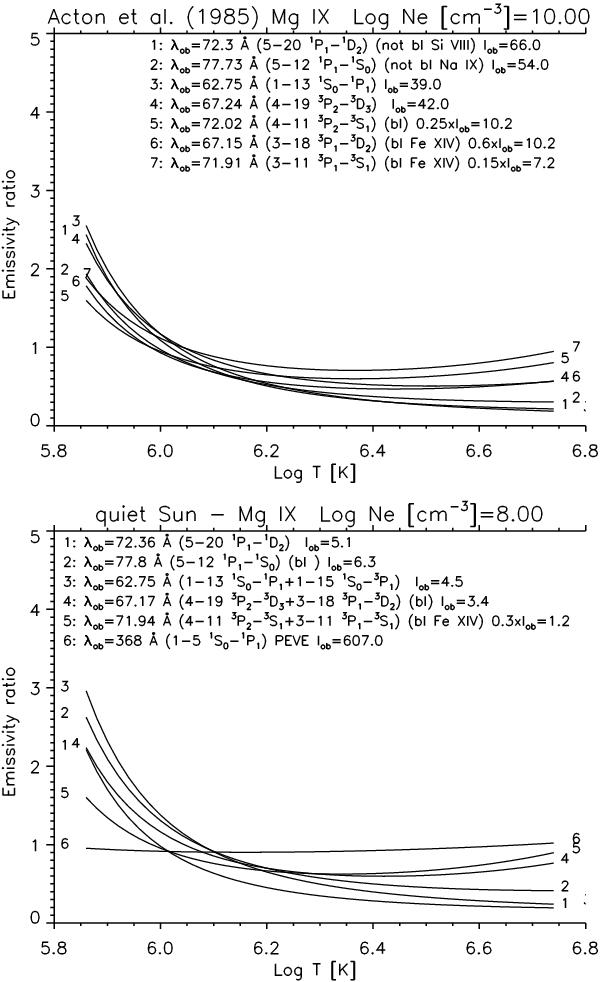
Emissivity ratio curves relative to the main Mg ix lines and the solar flare (A85) and quiet Sun (M72, PEVE) observations. λob indicates the observed wavelength (Å), Iob indicates the observed intensity, sometimes reduced by the amount indicated. (bl) indicates a blend.
This figure is made of several images, please see below:
Current usage metrics show cumulative count of Article Views (full-text article views including HTML views, PDF and ePub downloads, according to the available data) and Abstracts Views on Vision4Press platform.
Data correspond to usage on the plateform after 2015. The current usage metrics is available 48-96 hours after online publication and is updated daily on week days.
Initial download of the metrics may take a while.