| Issue |
A&A
Volume 546, October 2012
|
|
|---|---|---|
| Article Number | A122 | |
| Number of page(s) | 36 | |
| Section | Extragalactic astronomy | |
| DOI | https://doi.org/10.1051/0004-6361/201219733 | |
| Published online | 17 October 2012 | |
Hunting for extremely metal-poor emission-line galaxies in the Sloan Digital Sky Survey: MMT and 3.5 m APO observations ⋆,⋆⋆
1
Max-Planck-Institut für Radioastronomie,
Auf dem Hügel 69, 53121
Bonn,
Germany
2
Main Astronomical Observatory, Ukrainian National Academy of
Sciences, Zabolotnoho
27, Kyiv
03680,
Ukraine
e-mail: This email address is being protected from spambots. You need JavaScript enabled to view it.
3
Institut d’Astrophysique de Paris, 98bis boulevard Arago, 75014
Paris,
France
4
Astronomy Department, University of Virginia,
PO Box 400325, Charlottesville, VA
22904,
USA
Received: 1 June 2012
Accepted: 24 July 2012
Abstract
We present 6.5-m MMT and 3.5 m APO spectrophotometry of 69 H ii regions in 42 low-metallicity emission-line galaxies, selected from the data release 7 of the Sloan Digital Sky Survey to have mostly [O iii]λ4959/Hβ ≲ 1 and [N ii]λ6583/Hβ ≲ 0.1. The electron temperature-sensitive emission line [O iii] λ4363 is detected in 53 H ii regions allowing a direct abundance determination. The oxygen abundance in the remaining 16 H ii regions is derived using a semi-empirical method. The oxygen abundance of the galaxies in our sample ranges from 12 + log O/H ~ 7.1 to ~7.9, with 14 H ii regions in 7 galaxies with 12 + log O/H ≤ 7.35. In 5 of the latter galaxies, the oxygen abundance is derived here for the first time. Including other known extremely metal-deficient emission-line galaxies from the literature, e.g. SBS 0335−052W, SBS 0335−052E and I Zw 18, we have compiled a sample of the 17 most metal-deficient (with 12 + log O/H ≤ 7.35) emission-line galaxies known in the local universe. There appears to be a metallicity floor at 12 + log O/H ~ 6.9, suggesting that the matter from which dwarf emission-line galaxies formed was pre-enriched to that level by e.g. Population III stars.
Key words: galaxies: abundances / galaxies: irregular / galaxies: evolution / galaxies: ISM / HII regions / ISM: abundances
Based on observations with the Multiple Mirror telescope (MMT) and the 3.5 m Apache Point Observatory (APO). The MMT is operated by the MMT Observatory (MMTO), a joint venture of the Smithsonian Institution and the University of Arizona. The Apache Point Observatory 3.5-m telescope is owned and operated by the Astrophysical Research Consortium.
Figures 1–3 and Tables 2–8 are available in electronic form at http://www.aanda.org
© ESO, 2012
1. Introduction
Extremely metal-deficient (XMD) emission-line galaxies at low redshifts are the most promising young galaxy candidates in the local Universe (Guseva et al. 2003; Izotov & Thuan 2004b). Those XMD objects are often defined as emission-line galaxies with an oxygen abundance 12+log O/H ≤ 7.65 (e.g. Kniazev et al. 2003; Kakazu et al. 2007; Pustilnik & Martin 2007; Ekta & Chengalur 2010), a definition which we will adopt hereafter. These galaxies are important to identify because of several reasons. First, their nearly pristine interstellar medium (ISM) can shed light on the properties of the primordial ISM at the time of galaxy formation. There is now some evidence of a metallicity floor, i.e. that even the most metal-deficient star-forming galaxies in the local Universe formed from matter which was already pre-enriched by a previous star formation episode, e.g. by Population III stars (Thuan et al. 2005). A similar metallicity floor appears also to be present in damped Lyα systems (Prochaska et al. 2003). It is thus quite important to find as many emission-line XMD galaxies as possible, especially the ones with the lowest metallicities, to have enough statistics to assess the reality of such a metallicity floor, and in so doing, to establish firmly the level of that pre-enrichment. Second, because they have not undergone much chemical evolution, these galaxies are also the best objects for the determination of the primordial 4He abundance Yp (e.g. Izotov & Thuan 2004a; Izotov et al. 2007). A recent determination of Yp (Izotov & Thuan 2010) appears to indicate that a small deviation from the standard Big Bang nucleosynthesis model may exist, suggesting new physics such as the existence of light sterile neutrinos. It is important to confirm this result by improving the determination of Yp with as many XMD emission-line galaxies as possible. Third, in the hierarchical picture of galaxy formation, large galaxies form from the assembly of small dwarf galaxies. While much progress has been made in finding large populations of galaxies at high redshifts (::tag lxir empty(lxir-formule)id=560 content=z!/ga!/,3, Steidel et al. 2003), truly young galaxies in the process of forming remain elusive in the distant universe. The spectra of those far-away galaxies generally show the presence of a substantial amount of heavy elements, indicating previous star formation and metal enrichment. Therefore, XMD emission-line dwarf galaxies are possibly the closest approximations we can find of the elementary primordial units from which galaxies formed. Their relative proximity allows studies of their stellar, gas and dust content with a sensitivity, spectral and spatial resolution that faint distant high-redshift galaxies do not allow.
XMD emission-line galaxies are however very rare (e.g. Kunth & Östlin 2000). Many surveys have been carried out to search for such galaxies without significant success. For more than three decades, one of the first blue compact dwarf (BCD) galaxies discovered, I Zw 18 (Sargent & Searle 1970), continued to hold the record as the most metal-deficient emission-line galaxy known, with an oxygen abundance 12 + log O/H = 7.17 ± 0.01 in its northwestern component and 7.22 ± 0.02 in its southeastern component (Thuan & Izotov 2005). Only very recently, has I Zw 18 been displaced by the BCD SBS 0335–052W which was discovered by Pustilnik et al. (1997). This galaxy, with an oxygen abundance 12+log O/H = 7.12 ± 0.03, is now the emission-line galaxy with the lowest metallicity known (Izotov et al. 2005). Recently, Izotov et al. (2009) derived the oxygen abundance in four H ii regions of SBS 0335–052W and found that it varies from region to region in the range 6.86–7.22.
Because of the scarcity of XMD emission-line galaxies such as I Zw 18 and SBS 0335–052W, we stand a better chance of finding them in very large spectroscopic surveys. One of the best surveys suitable for such a search is the Sloan Digital Sky Survey (SDSS; York et al. 2000). However, despite intensive studies of galaxies with a detected temperature-sensitive [O iii] λ4363 emission line in their spectra, no emission-line galaxy with an oxygen abundance as low as that of I Zw 18 has been discovered in the SDSS data release 3 (DR3) and earlier releases. The lowest-metallicity emission-line galaxies found in these releases have oxygen abundances 12+log O/H > 7.4 (Kniazev et al. 2003, 2004; Izotov et al. 2004, 2006a). Only recently, have Pustilnik et al. (2005), Izotov et al. (2006b), Izotov & Thuan (2007, 2009) and Guseva et al. (2007) found several galaxies with 12+log O/H ≤ 7.35 in later SDSS spectroscopic releases.
In order to find new candidates for XMD emission-line galaxies, we have carried out a systematic search for such objects in the SDSS data release 7 (DR7). We have chosen them mainly on the basis of the relative fluxes of selected emission lines, as described in Izotov et al. (2006b) and Izotov & Thuan (2007). All known XMD emission-line galaxies are characterised by relatively weak (compared to Hβ) [O ii] λ3727, [O iii] λ4959, λ5007 and [N ii] λ6583 emission lines (e.g. Izotov & Thuan 1998a,b; Izotov et al. 2005; Pustilnik et al. 2005; Izotov et al. 2006b). These spectral properties select out uniquely low-metallicity dwarfs since no other type of galaxy possesses them. This technique appears to be more efficient in uncovering XMD galaxies with the lowest metallicities, those with 12+log O/H ≤ 7.35, as compared to the selection technique based on broad-band photometric colors used e.g. by Brown et al. (2008) who found only objects with 12+log O/H > 7.35. In contrast to previous studies (Kniazev et al. 2003, 2004; Izotov et al. 2004, 2006a) which focus exclusively on objects with a detected [O iii] λ4363 emission line in the SDSS sprectra, we have also considered objects which satisfy the criteria described above, but with spectra where [O iii] λ4363 is weak or not detected. Since the [O ii] λ3727 line is out of the observed wavelength range in SDSS spectra of galaxies with a redshift z lower than 0.02, we use the two following criteria to select candidate XMD emission-line galaxies: [O iii]λ4959/Hβ ≲ 1 and [N ii]λ6583/Hβ ≲ 0.1. The efficiency of this technique to achieve our goals has been demonstrated by Izotov et al. (2006b) and Izotov & Thuan (2007).
While the SDSS spectra allow us to select very low metallicity galaxies, we need additional spectral observations for the following reasons: 1) spectra that go further into the blue wavelength range than SDSS spectra are required to detect the [O ii] λ3727 line. For a precise oxygen abundance determination, this line is needed to provide information on the singly ionised ionic population of oxygen. In principle, the [O ii] λ7320, 7330 emission lines can be used instead. However, these lines are very weak or not detected in the SDSS spectra of low-metallicity candidates; 2) a better signal-to-noise ratio spectrum may allow the detection of a weak [O iii] λ4363 emission line, which would permit a direct determination of the electron temperature; 3) very often, low-metallicity candidates possess two or more H ii regions with different degrees of excitation. However, SDSS spectra are usually obtained for only one H ii region, chosen sometimes not in the most optimal way.
General characteristics of galaxies.
For these reasons, we have obtained new spectroscopic observations with the 3.5 m APO telescope and the MMT of a sample of SDSS XMD emission-line galaxy candidates. In addition to the galaxies selected by using the criteria described above, we have also selected a subsample of low-redshift (z < 0.02) SDSS galaxies with high excitation ([O iii]λ4959/Hβ > 1) to improve their abundance determination with MMT/Blue channel observations, because their [O ii]λ3727 emission line is not included in the spectral range of their SDSS spectra. The motivation for observing this subsample is the fact that XMD BCDs like I Zw 18 and SBS 0335−052 are also often characterised by high excitation. The observations and data reduction are discussed in Sect. 2. The element abundances are derived in Sect. 3. We consider in Sect. 4 the luminosity−metallicity relations for XMD emission-line galaxies and the issue of a metallicity floor, and in Sect. 5 their location in the emission-line diagnostic diagram. Our main findings are summarised in Sect. 6.
Abundances, extinction coefficients, Hβ equivalent widths, and absolute magnitudes.
2. Observations and data reduction
2.1. APO observations
New optical spectra were obtained for a subsample of galaxies using the 3.5 m APO telescope in the course of several nights during the February 2008–February 2009 period. The general characteristics of these galaxies, such as redshift, distance, apparent B magnitude (if available in the literature) or SDSS g magnitude and other names are shown in Table 1. The Journal of observations is shown in Table 2. The 3.5 m APO observations were made with the Dual Imaging Spectrograph (DIS) in the both the blue and red wavelength ranges. In the blue range, we use the B400 grating with a linear dispersion of 1.83 Å/pix and a central wavelength of 4400 Å, while in the red range we use the R300 grating with a linear dispersion 2.31 Å/pix and a central wavelength of 7500 Å. The above instrumental set-up gave a spatial scale along the slit of 0 4 pixel-1, a spectral range ~3600–9600 Å and a spectral resolution of 7 Å (FWHM). The slit orientation, the total exposure time and the airmass during observations are shown in Table 2. Several Kitt Peak IRS spectroscopic standard stars were observed for flux calibration. Spectra of He-Ne-Ar comparison arcs were obtained at the beginning or the end of each night for wavelength calibration.
2.2. MMT observations
The MMT spectrophotometric observations were obtained on the nights of 2008 March 28–29, and 2010 April 13. The galaxies are listed in Table 1 separately for low- and medium- spectral resolution observations. All observations have been made with the Blue Channel of the MMT spectrograph. The log of the observations is given in Table 2. We used a 300 grooves/mm grating in first order for the low-resolution observations and a 800 grooves/mm grating in first order for the medium-resolution observations. The above instrumental set-ups gave a spatial scale along the slit of 06 pixel-1, and respectively a spectral range of 3600−7500 Å and a spectral resolution of ~7 Å (FWHM) for the low-resolution observations, and of 3200−5200 Å and ~3 Å (FWHM) for the medium-resolution ones. The total exposure times, orientations of the slit and airmasses for each MMT observation are given in Table 2. In 2008, the Kitt Peak IRS spectroscopic standard stars BD 33d2642 and HZ 44 were observed for flux calibration during the first night, while BD 33d2642, BD 75d325 and Feige 34 were observed during the second night. In 2010, BD 33d2642, BD 75d325 and Feige 34 were observed. Spectra of He-Ne-Ar comparison arcs were obtained before and after each observation to calibrate the wavelength scale.
2.3. Results
Several galaxies listed in Table 1 have been observed previously by other authors. To improve their abundance determination, we have reobserved J0113+0052, DDO 68, SBS 1116+517, SBS 1129+576, SBS 1420+544 and PHL 293B. Two galaxies, J1121+3744 and J0834+5905, were observed twice, both with the 3.5 m APO and the MMT.
The two-dimensional spectra were bias subtracted and flat-field corrected using IRAF1. We then use the IRAF software routines IDENTIFY, REIDENTIFY, FITCOORD, TRANSFORM to perform wavelength calibration and correct for distortion and tilt for each frame. One-dimensional spectra were then extracted from each frame using the APALL routine. The sensitivity curve was obtained by fitting with a high-order polynomial the observed spectral energy distribution of standard stars. Then sensitivity curves obtained from observations of different stars during the same night were averaged.
The 3.5 m APO, the low- and medium-resolution MMT H ii region spectra are shown respectively in Figs. 1–3. These spectra have all been reduced to zero redshift.
The extinction-corrected line fluxes I(λ), normalised to I(Hβ) and multiplied by a factor of 100, and their errors, derived from the 3.5 m APO, MMT low-resolution and MMT medium-resolution observations are given in Tables 3–5, respectively. The data were obtained using the IRAF SPLOT routine. The line flux errors listed include statistical errors derived with SPLOT from non-flux calibrated spectra, in addition to errors introduced in the standard star absolute flux calibration, which we set to 1% of the line fluxes. These errors will be later propagated into the calculation of abundance errors. The line fluxes were corrected for both reddening (using the extinction curve of Whitford 1958) and underlying hydrogen stellar absorption derived simultaneously by an iterative procedure as described in Izotov et al. (1994). The extinction coefficient is defined as C(Hβ) = 1.47E(B − V), where E(B − V) = A(V)/3.2 and A(V) is the extinction in the V band (Aller 1984). Equivalent widths EW(Hβ), extinction coefficients C(Hβ), and equivalent widths EW(abs) of the hydrogen absorption stellar lines are also given in Tables 3–5, along with the uncorrected Hβ fluxes.
3. Physical conditions and element abundances
To determine element abundances, we generally follow the procedures of Izotov et al. (1994, 1997) and Thuan et al. (1995). We adopt a two-zone photoionised H ii region model: a high-ionisation zone with temperature Te(O iii), where [O iii] and [Ne iii] lines originate, and a low-ionisation zone with temperature Te(O ii), where [O ii], [N ii] and [S ii] lines originate. As for the [S iii] and [Ar iii] lines they originate in the intermediate zone between the high and low-ionisation regions. In the H ii regions with a detected [O iii] λ4363 emission line, the temperature Te(O iii) is calculated using the “direct” method based on the [O iii] λ4363/(λ4959+λ5007) line ratio. In H ii regions where the [O iii] λ4363 emission line is not detected, we used a semi-empirical method described by Izotov & Thuan (2007) to derive Te(O iii).
For Te(O ii), we use the relation between the electron temperatures Te(O iii) and Te(O ii) obtained by Izotov et al. (2006a) from the H ii photoionisation models of Stasińska & Izotov (2003). These are based on more recent stellar atmosphere models and improved atomic data as compared to the Stasińska (1990) models. Ionic and total heavy element abundances are derived using expressions for ionic abundances and ionisation correction factors obtained by Izotov et al. (2006a). The element abundances are given in Tables 6–8 along with the adopted electron temperatures for different ions.
Table 9 summarises the abundance determinations for all H ii regions, where we show the oxygen abundance 12+log O/H, the logarithms of abundance ratios log N/O, log Ne/O, log S/O and log Ar/O, the extinction coefficient C(Hβ), the equivalent width of the Hβ emission line, and the galaxy’s absolute magnitude in the SDSS g band or in the B band whenever available from the literature. Examination of this Table shows that our sample consists of H ii regions spanning a wide range of oxygen abundance 12+log O/H = 7.1−7.9. That range is clearly on the low metallicity side of the roughly Gaussian metallicity distribution of BCDs which peaks at 12+log O/H ~ 8.1 (Thuan 2008). For comparison, the 12+log O/H of the Small and Large Magellanic Clouds and the Sun are respectively 8.03, 8.35 (Russell & Dopita 1992) and 8.69 (Asplund et al. 2009). One of the H ii regions, J1121+3744 No.1, has an abnormally low oxygen abundance. We derived 12+log O/H = 6.78 ± 0.16 from its 3.5 m APO spectrum. However, because of its faintness, the APO spectrum is noisy (Fig. 1), and we have reobserved J1121+3744 No. 1 with the MMT. The oxygen abundance obtained from the MMT spectrum (Fig. 3) is significantly higher, 12+log O/H = 7.12. However, it is still among the lowest known. Note, however, that no [O iii] λ4363 emission line is detected, therefore its abundance has been derived using the semi-empirical method, making it less certain. The present sample contains 7 galaxies with 12+log O/H ≤ 7.35. For two galaxies, J0113+0052 and DDO 68, we confirm the very low oxygen abundances first found by Izotov et al. (2006b) and Pustilnik et al. (2005), respectively. As for the remaining five XMD galaxies, J0834+5905, J1056+3608, J1057+1358, J1121+3744 and J1146+4050, their oxygen abundances are derived for the first time in the present paper.
In Table 10 we show, in order of increasing oxygen abundance, the list of the 17 lowest metallicity XMD emission-line galaxies known so far, including the galaxies studied in this paper. It is seen from Table 10 that no H ii region with an oxygen abundance 12+log O/H < 7.1 has been found, except for three H ii regions (out of four observed) in SBS 0335–052W. This supports the idea discussed by, e.g., Thuan et al. (2005) that the matter from which dwarf emission-line galaxies formed was pre-enriched to a level 12+log O/H ≳ 6.9 (or ~2% of the abundance 12+log O/H = 8.69 of the Sun, Asplund et al. 2009). Based on FUSE spectroscopic data, Thuan et al. (2005) showed that BCDs spanning a wide range in ionised gas metallicities all have H i envelopes with about the same neutral gas metallicity of ~7.0. This is also the metallicity found in Lyα absorbers (Prochaska et al. 2003). Taken together, the available data suggest that there may have been previous enrichment of the primordial neutral gas to a common metallicity level 12+log O/H ~ 6.9, possibly by Population III stars.
As for other heavy elements, we show in Fig. 4 by large circles the location of our sample galaxies in the log N/O, log Ne/O, log S/O and log Ar/O vs. oxygen abundance diagrams. The filled large circles represent galaxies with element abundances determined by the direct method while the open large circles show those with element abundances determined by the semi-empirical method. Examination of Fig. 4 shows that there is no systematic difference between the filled and open large circles. For comparison, smaller filled circles show the galaxies from the sample of Izotov & Thuan (2004a) used for the primordial He abundance determination, and dots show the emission-line galaxies from the SDSS DR3 (Izotov et al. 2006a). In general, the locations of our galaxies are consistent with those obtained for other emission-line galaxies. However, since many of the galaxies studied in this paper are faint and with weak emission lines in their spectra, they show a larger scatter in Fig. 4 as compared to galaxies from the comparison sample. Higher signal-to-noise ratio observations with large telescopes are needed to improve the abundance determination in these galaxies.
List of the most metal-deficient emission-line galaxies known.
4. XMD emission-line galaxies and the luminosity–metallicity relation
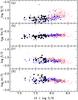 |
Fig. 4 Abundance ratios vs. oxygen abundance. The emission-line galaxies from this paper are shown by large circles, the filled circles representing galaxies with element abundances derived by the direct method, and the open ones galaxies with element abundances derived by the semi-empirical method; small filled circles are XMD emission-line galaxies from Izotov & Thuan (2004a), and dots are SDSS galaxies from Izotov et al. (2006a). |
It was established more than 30 years ago that low-luminosity dwarf galaxies have systematically lower metallicities as compared to more luminous galaxies (Lequeux et al. 1979; Skillman et al. 1989; Richer & McCall 1995). The study of this dependence sheds light on the physics of galaxy and star formation. The relation may also be potentially useful in searching for XMD emission-line galaxies, in addition to our selection criterion based on the fluxes of [O iii] λ4959, 5007 and [N ii] λ6584 emission lines relative to Hβ.
As a measure of metallicity and luminosity of each galaxy, we adopt respectively the oxygen abundance 12+log O/H and the absolute magnitude Mg in the g band or MB in the B band. We will call their dependence on one another the “luminosity−metallicity” or “L − Z” relation. Because Papaderos et al. (2008) have shown that, for emission-line galaxies, the B − g color index is <0.1 mag, we have not transformed B magnitudes to g magnitudes and have used either one, whenever available in the literature. For the galaxy distances, we have selected the ones from the NASA/IPAC Extragalactic Database (NED)2 which are obtained from the radial velocities corrected for Virgo infall only. Distances and apparent g or B magnitudes are given in Table 1 for all our galaxies. In the cases where several H ii regions were observed within the same galaxy, the same distance and g or B magnitude of the whole galaxy were assigned to each H ii region. The derived absolute magnitudes Mg or MB for all the galaxies in our sample are shown in Table 9. They were obtained from the apparent magnitudes in Table 1 and corrected for extinction as defined by C(Hβ) in Table 9 for a single star-forming region, or by the average value of C(Hβ) in the case of multiple knots of star formation.
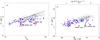 |
Fig. 5 a) Absolute g magnitude–oxygen abundance relation. The emission-line galaxies from this paper are shown by large circles, the filled circles representing galaxies with element abundances derived by the direct method, and the open ones galaxies with element abundances derived by the semi-empirical method; the XMD emission-line galaxies of Izotov & Thuan (2007) are shown by red asterisks, and the SDSS galaxies of Izotov et al. (2006a) by black dots. The dashed line is the linear regression to all these data. The solid line is the relation derived by Skillman et al. (1989), the dotted line is the one derived by Richer & McCall (1995), and the dot-dashed line is the one derived by Berg et al. (2012). For comparison, the most-metal deficient BCDs I Zw 18, SBS 0335–052W and SBS 0335–052E are shown by blue, magenta and red stars, respectively, and labelled. b) Hβ luminosity–oxygen abundance relation. The symbols are the same as in a). The solid line is the linear regression to all data, excluding I Zw 18, SBS 0335–052W and SBS 0335–052E. |
The luminosity−metallicity diagram for the present sample (Table 1) is shown in Fig. 5a by blue large filled and open circles. The XMD emission-line galaxies discussed by Izotov & Thuan (2007), also selected from the SDSS with the same selection criteria, are shown by red asterisks. For comparison, the dots show the large sample of emission-line galaxies studied by Izotov et al. (2006a). The latter sample includes all emission-line star-forming galaxies from the SDSS DR3 with a reliably detected [O iii] λ4363 emission line (its flux is at least 4 times the flux error). The distances to the SDSS DR3 galaxies are derived from their radial velocities, adopting a Hubble constant H0 = 75 km s-1 Mpc-1. All nearby objects with z < 0.003, and hence with a less certain distance, are excluded from the SDSS DR3 sample. We have also excluded all SDSS galaxies with z > 0.03, thus restricting our sample to dwarf galaxies. Totally, the SDSS DR3 sample in Fig. 5a contains 272 galaxies. We have also shown and labelled the most-metal deficient BCDs known, SBS 0335–052W, SBS 0335–052E and I Zw 18, by blue, magenta and red stars, respectively. We show respectively by the solid, dotted, and dot-dashed lines the L − Z relations obtained by Skillman et al. (1989), Richer & McCall (1995), and Berg et al. (2012) for nearby dwarf irregular galaxies.
It can be seen from Fig. 5a that the SDSS DR3 galaxies with Mg > −18 mag are slightly offset to brighter magnitudes as compared to the L − Z relations of Skillman et al. (1989), Richer & McCall (1995), and Berg et al. (2012). Fitting the data set composed of the SDSS DR3 galaxies (black dots) and the emission-line galaxies from Izotov & Thuan (2007) (red asterisks) and from the present paper (blue filled and open circles) by a linear regression gives:  (1)This linear regression is shown in Fig. 5a by a dashed line. It has a slope shallower than the ones of −0.165 from Skillman et al. (1989) and of −0.147 from Richer & McCall (1995). On the other hand, the slope of our relation (Eq. (1)) is the same as that by Berg et al. (2012). However, the relation defined by Eq. (1) is shifted by ~0.2 dex to lower oxygen abundances indicating that we find more metal-poor galaxies with our selection criteria. The spread of the data points about the fit is partially due to observational uncertainties, but also to the way the samples are selected. The SDSS DR3 galaxies have been selected to have a detectable [O iii] λ4363 emission line, and hence to have strong star formation, in contrast to the more quiescent dwarf irregular galaxies studied by Skillman et al. (1989) and Richer & McCall (1995). The shallower slope of the relation defined by Eq. (1) as compared to the relations by Skillman et al. (1989) and Richer & McCall (1995) is due to the offset, at a given metallicity, to brighter magnitudes of the SDSS DR3 and emission-line galaxies in the present sample. Guseva et al. (2009) have found that galaxies with such strong ongoing star formation tend to be shifted to brighter magnitudes as compared to galaxies in a more quiescent stage. Using the equivalent width EW(Hβ) of the Hβ emission line as a measure of the relative contribution of star forming regions to the total luminosity of the galaxy, they demonstrated that the galaxies with high EW(Hβ) > 100 Å are brighter in the L − Z diagram as compared to the galaxies with EW(Hβ) < 20 Å.
Thus, the XMD galaxies (asterisks, open and filled circles) do not follow the relations shown by the solid, dashed, and dot-dashed lines. They lie in a horizontal band defined by 7.1 < 12+log O/H < 7.9, and their metallicities appear to be independent of luminosity over a wide range of galaxy absolute brightnesses −19 < Mg, MB < −13. The fact that our emission-line galaxies all have relatively low metallicities is not surprising: it is a result of the way they have been selected, by considering certain emission line flux ratios lying in certain ranges, as described before. What may be more surprising is the very large range of absolute magnitudes −17 < Mg, MB < −11 mag for the galaxies with the lowest metallicities (12+log O/H < 7.5) in our sample. As examples of extreme outliers, we have indicated by stars the location of three of the most metal-deficient galaxies known, SBS 0335−052W, and SBS 0335−052E and I Zw 18. In particular, for its oxygen abundance, the galaxy SBS 0335−052E is some 5.5 mag brighter than the luminosity expected from the L − Z relation by Skillman et al. (1989) (solid line). This high luminosity is due to the presence of several luminous super-star clusters in SBS 0335−052E (Thuan et al. 1997). Ekta & Chengalur (2010) have attributed the deviations of XMD emission-line galaxies from the L − Z relation to a combination of a high H i gas content (they have processed less gas into stars than other galaxies) and of a more uniform mixing of metals in their ISM due to tidal interactions. Thus, the use of the luminosity−metallicity relation to pick out XMD galaxies, especially the bright ones, is not as reliable as our selection method based on the relative fluxes of emission lines.
In Fig. 5b, we show the relation between the Hβ luminosity L(Hβ) and the oxygen abundance for the same galaxies as in Fig. 5a. The upper abscissa shows the corresponding star formation rate (SFR), derived from the Hα luminosity and the relation SFR = 7.9 × 10-42L(Hα) of Kennicutt (1998), where SFR is in M⊙ yr-1 and L(Hα) is in erg s-1. For log L(Hβ) < 39.5, it is seen that the emission-line galaxies in both the present and Izotov & Thuan (2007) samples follow nicely the relation defined by the SDSS DR3 galaxies, down to the low-luminosity (or low SFR) range. There appears to be a flattening for log L(Hβ) > 39.5, but it is a result of our selection criteria which pick out only galaxies with 12+log O/H ≲ 7.6−7.8. The joint fit to the present, the Izotov & Thuan (2007) and the SDSS DR3 samples gives the linear regression  (2)where L(Hβ) is in erg s-1.
From inspection of Fig. 5b, we conclude that the most metal-deficient H ii regions, those with 12+log O/H ≤ 7.35, are found among galaxies with the lowest Hβ luminosities, those with log L(Hβ) ≲ 37.5. Given that a single O5V star produces a Hβ luminosity of 4.8 × 1036 erg s-1 (or log L(O5V) = 36.68) (Leitherer 1990), this means that only one or a few O stars are sufficient to ionise the ISM in these XMD emission-line galaxies with low L(Hβ). Thus, a good recipe for finding XMD emission-line galaxies would be to search for galaxies with very low Hβ luminosities, those with log L(Hβ) ≲ 37.5. However, this is a very challenging task since in these galaxies, the emission lines would be intrinsically weak, and only very nearby XMD emission-line galaxies would be apparently bright enough for reliable abundance determination. There are however a few bright galaxies that are outliers, including three well-known XMD BCDs with 12+log O/H < 7.3, in Fig. 5b: SBS 0335−052W, SBS 0335−052E and I Zw 18. They are bright because there are presently undergoing an intense starburst with a high SFR. This starburst produces copious amounts of ionising photons resulting in high-excitation H ii regions.
In summary, our attempts to find I Zw 18-like or SBS 0335−052-like objects by searching the entire SDSS spectroscopic survey, containing ~106 galaxy spectra, have not been a resounding success. No such galaxy was found in the SDSS, except for I Zw 18 itself. The other two galaxies, SBS 0335−052W and SBS 0335−052E, are outside the sky region covered by the SDSS. Although the number of XMD galaxies with oxygen abundances near the metallicity floor has grown, none of the newly discovered ones listed in Table 10 is both as bright in apparent magnitude and contains high-excitation H ii regions as the two well-known prototype XMD BCDs I Zw 18 and SBS 0335–052E, discovered respectively by Sargent & Searle (1970) and Izotov et al. (1990). Because of their brightness and their high-excitation H ii regions, these objects have allowed high-sensitivity and high spatial resolution multiwavelength studies of their star formation and chemical evolution properties that none of the newly discovered XMD emission-line galaxies will permit (see Thuan 2008, for a review). After more than 40 years of search for the most metal-poor galaxies, I Zw 18 and SBS 0335–052E still remain the most interesting objects among XMD emission-line galaxies.
5. XMD emission-line galaxies and the emission-line diagnostic diagram
Finally, in Fig. 6 we show the location of the most metal-poor galaxies in the Baldwin-Phillips-Terlevich (BPT) diagnostic diagram (Baldwin et al. 1981) for emission-line galaxies. The cloud of grey dots represents the location of the ~100 000 SDSS DR7 galaxies. The dashed and solid lines (Kauffmann et al. 2003; Stasińska et al. 2006) separate star-forming galaxies (to the left of the lines) from active galactic nuclei (to the right of the lines). Open black circles are luminous compact galaxies (LCGs) with high SFRs of ~1−60 M⊙ yr-1 which occupy the upper tail of the star-forming galaxy region. LCGs were studied in detail by Izotov et al. (2011) who found that their oxygen abundance distribution peaks at 12+log O/H of ~8.0. The emission-line galaxies observed and discussed in the present paper are shown by filled blue circles. They are located below the region where lie the bulk of the star-forming galaxies, a sign of their less advanced chemical evolution and of their lower metallicities. The most metal-deficient galaxies known, listed in Table 10, are shown by red filled circles. We have plotted all observations of these galaxies that we could find in the literature, including multiple observations of SBS 0335–052E. It is evident from Fig. 6 that the lowest-metallicity emission-line galaxies occupy a region of the BPT diagram, which has been left vacant before by the known star-forming galaxy population. The lowest-metallicity galaxies have considerably smaller [O iii]/Hβ ratios and generally smaller [N ii]/Hα ratios. The Local Group dwarf irregular galaxy Leo A (encircled in Fig. 6) has the highest [O iii]/Hβ ratio among the known lowest-metallicity emission-line galaxies. We note that the oxygen abundance for Leo A has been derived from the spectrum of a planetary nebula, not of a H ii region (Skillman et al. 1989; van Zee et al. 2006). The fact that this region in the BPT diagram was left empty before suggests that the population of the most metal-poor emission-line galaxies in the local Universe is extremely small. This is born out by our rough search statistics. Out of one million SDSS spectra, we have isolated about 13000 emission-line objects with a detected [O iii]λ4363, and out of these there are ~15 galaxies with 12+log O/H ≤ 7.35, so the fraction of the most metal-poor emission-line galaxies in the local universe is ~0.1%.
6. Conclusions
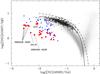 |
Fig. 6 The Baldwin-Phillips-Terlevich diagram (Baldwin et al. 1981) for emission-line galaxies. The emission-line galaxies observed in this paper are shown by filled blue circles and the most-metal deficient star-forming galaxies known (Table 10) are shown by red filled circles, including observations of several knots of star formation in SBS 0335–052E. The Local Group dwarf irregular galaxy Leo A is encircled. Also, plotted are the 100 000 emission-line galaxies from SDSS DR7 (cloud of grey dots) and a sample of 803 luminous compact galaxies (LCGs, open black circles) (Izotov et al. 2011). The dashed line from Kauffmann et al. (2003) and the solid line from Stasińska et al. (2006) separate star-forming galaxies from active galactic nuclei. The latter lie in the right wing of the “butterfly”. |
We present spectroscopic observations with the 6.5 m MMT and the 3.5 m APO telescope of a sample of 69 H ii regions in 42 dwarf emission-line galaxies. These galaxies were selected from the data release 7 (DR7) of the Sloan Digital Sky Survey (SDSS) using mainly two criteria: [O iii]λ4959/Hβ ≲ 1 and [N ii]λ6583/Hβ ≲ 0.1. These spectral properties select out extremely low-metallicity galaxies, with oxygen abundances comparable to those of the two prototype extremely metal-deficient (XMD) emission-line galaxies SBS 0335–052E and I Zw 18.
Our results are as follows:
-
1.
We find that 14 H ii regions in 7emission-line galaxies have oxygen abundances12+log O/H ≤ 7.35. Among them, the 2 galaxies J0113+0052 and DDO 68 have been observed previously. We confirm the very low oxygen abundances for J0113+0052 found by Izotov et al. (2006b) and for DDO 68 found by Pustilnik et al. (2005) and Izotov & Thuan (2007). In addition, we find 5 more galaxies with 12+log O/H ≤ 7.35. Our data set, when combined with previous studies, results in a total of 17 known XMD emission-line galaxies with 12+log O/H ≤ 7.35 (Table 10). Among all the emission-line galaxies that have been studied, there is no object that has been discovered with 12+log O/H < 6.9, although the selection criteria do not forbid such an object. This appears to suggest the existence of an oxygen abundance floor at that level, and supports the idea that the matter from which dwarf emission-line galaxies formed was pre-enriched to a level 12+log O/H ~ 6.9 (e.g., Thuan et al. 2005).
-
2.
We have examined the absolute magnitude−metallicity diagram for our emission-line galaxies. We find that these form an horizontal band where the metallicity appears to be nearly independent of luminosity over a wide range (~8 mag) of absolute magnitudes, corresponding to a luminosity range of ~1500. The inclusion of XMD emission-line galaxies in a sample of dwarf star-forming galaxies would make the slope of the absolute magnitude−metallicity relation shallower as compared to samples of more quiescent dwarf irregular galaxies, not including XMD emission-line galaxies, as those of Skillman et al. (1989) and Richer & McCall (1995). On the other hand, we find a tight relation between the Hβ luminosity and the metallicity for the combined sample of XMD and SDSS emission-line galaxies, where the luminosities change by a factor of ~105.
-
3.
Because of the large dispersion about the fit to the absolute magnitude−metallicity relation, the use of the latter is not a good way to select XMD emission-line galaxies. It is more efficient to select them on the basis of flux ratios of nebular [O iii] and [N ii] relative to Hβ emission lines, and by using the Hβ luminosity−metallicity relation. We find that more than ~1/3 of the studied H ii regions with log L(Hβ) ≲ 37.5 are XMD galaxies with 12+log O/H ≤ 7.35. On the other hand, we have failed to find more bright extremely metal-poor emission-line galaxies in the complete SDSS spectroscopic survey, similar to the prototype BCDs SBS 0335−052E and I Zw 18.
Online material
Journal of observations.
Emission line intensities in 3.5 m APO spectra.
Emission line intensities in low-resolution MMT spectra.
Emission line intensities in medium-resolution MMT spectra.
Ionic and total heavy element abundances derived from 3.5 m APO spectra.
Ionic and total heavy element abundances derived from the low-resolution MMT spectra.
Ionic and total heavy element abundances derived from the high-resolution MMT spectra.
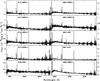 |
Fig. 1 3.5 m APO spectra of galaxies. |
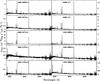 |
Fig. 1 continued. |
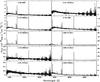 |
Fig. 1 continued. |
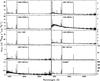 |
Fig. 1 continued. |
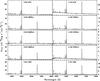 |
Fig. 2 Low-resolution MMT spectra. |
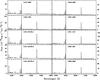 |
Fig. 2 continued. |
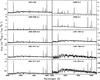 |
Fig. 3 Medium-resolution MMT spectra. |
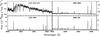 |
Fig. 3 continued. |
IRAF is distributed by National Optical Astronomical Observatory, which is operated by the Association of Universities for Research in Astronomy, Inc., under cooperative agreement with the National Science Foundation.
This research has made use of the NASA/IPAC Extragalactic Database (NED) which is operated by the Jet Propulsion Laboratory, California Institute of Technology, under contract with the National Aeronautics and Space Administration.
Acknowledgments
This research has been supported by NSF grant AST-02-05785 and NASA contract 1263707. Y.I.I. thanks the hospitality of the Astronomy Department of the University of Virginia, USA. Y.I.I. and N.G.G. thank the hospitality of the Max-Planck Institute for Radioastronomy, Bonn, Germany. T.X.T. thanks the hospitality of the Institut d’Astrophysique de Paris. Funding for the Sloan Digital Sky Survey (SDSS) and SDSS-II has been provided by the Alfred P. Sloan Foundation, the Participating Institutions, the National Science Foundation, the US Department of Energy, the National Aeronautics and Space Administration, the Japanese Monbukagakusho, and the Max Planck Society, and the Higher Education Funding Council for England.
References
- Aller, L. H. 1984, Physics of Thermal Gaseous Nebulae (Dordrecht: Reidel) [Google Scholar]
- Asplund, M., Grevesse, N., & Sauval, A. J., & Scott, P. 2009, ARA&A, 47, 481 [NASA ADS] [CrossRef] [Google Scholar]
- Baldwin, J. A., Phillips, M. M., & Terlevich, R. 1981, PASP, 93, 5 [NASA ADS] [CrossRef] [EDP Sciences] [Google Scholar]
- Berg, D. A., Skillman, E. D., Marble, A. R., et al. 2012, ApJ, 754, 98 [NASA ADS] [CrossRef] [Google Scholar]
- Brown, W. R., Kewley, L. J., & Geller, M. J. 2008, ApJ, 135, 92 [CrossRef] [Google Scholar]
- de Vaucouleurs, G., de Vaucouleurs, A., Corwin, H., Jr., et al. 1991, Third Reference Catalogue of Bright Galaxies (New York: Springer) [Google Scholar]
- Doyle, M. T., Drinkwater, M. J., Rohde, D. J., et al. 2005, MNRAS, 361, 34 [NASA ADS] [CrossRef] [MathSciNet] [Google Scholar]
- Ekta, B., & Chengalur, J. N. 2010, MNRAS, 406, 1238 [NASA ADS] [Google Scholar]
- Guseva, N. G., Papaderos, P., Izotov, Y. I., et al. 2003, A&A, 407, 105 [NASA ADS] [CrossRef] [EDP Sciences] [Google Scholar]
- Guseva, N. G., Izotov, Y. I., Papaderos, P., & Fricke, K. J. 2007, A&A, 464, 885 [NASA ADS] [CrossRef] [EDP Sciences] [Google Scholar]
- Guseva, N. G., Papaderos, P., Meyer, H., Izotov, Y. I., & Fricke, K. J. 2009, A&A, 505, 63 [NASA ADS] [CrossRef] [EDP Sciences] [Google Scholar]
- Izotov, Y. I., & Thuan, T. X. 1998a, ApJ, 497, 227 [NASA ADS] [CrossRef] [Google Scholar]
- Izotov, Y. I., & Thuan, T. X. 1998b, ApJ, 500, 188 [NASA ADS] [CrossRef] [Google Scholar]
- Izotov, Y. I., & Thuan, T. X. 2004a, ApJ, 602, 200 [CrossRef] [Google Scholar]
- Izotov, Y. I., & Thuan, T. X. 2004b, ApJ, 616, 768 [CrossRef] [Google Scholar]
- Izotov, Y. I., & Thuan, T. X. 2007, ApJ, 665, 1115 [NASA ADS] [CrossRef] [Google Scholar]
- Izotov, Y. I., & Thuan, T. X. 2009, ApJ, 690, 1797 [NASA ADS] [CrossRef] [Google Scholar]
- Izotov, Y. I., & Thuan, T. X. 2010, ApJ, 710, L67 [NASA ADS] [CrossRef] [EDP Sciences] [MathSciNet] [Google Scholar]
- Izotov, Y. I., Guseva, N. G., Lipovetsky, V. A., Kniazev, A. Y., & Stepanian, J. A. 1990, Nature, 343, 238 [NASA ADS] [CrossRef] [Google Scholar]
- Izotov, Y. I., Thuan, T. X., & Lipovetsky, V. A. 1994, ApJ, 435, 647 [NASA ADS] [CrossRef] [Google Scholar]
- Izotov, Y. I., Thuan, T. X., & Lipovetsky, V. A. 1997, ApJS, 108, 1 [NASA ADS] [CrossRef] [Google Scholar]
- Izotov, Y. I., Stasińska, G., Guseva, N. G., & Thuan, T. X. 2004, A&A, 632, 210 [Google Scholar]
- Izotov, Y. I., Thuan, T. X., & Guseva, N. G. 2005, ApJ, 632, 210 [NASA ADS] [CrossRef] [Google Scholar]
- Izotov, Y. I., Stasińska, G., Meynet, G., Guseva, N. G., & Thuan, T. X. 2006a, A&A, 448, 955 [NASA ADS] [CrossRef] [EDP Sciences] [Google Scholar]
- Izotov, Y. I., Papaderos, P., Guseva, N. G., Fricke, K. J., & Thuan, T. X. 2006b, A&A, 454, 137 [NASA ADS] [CrossRef] [EDP Sciences] [Google Scholar]
- Izotov, Y. I., Thuan, T. X., & Stasińska, G. 2007, ApJ, 662, 15 [NASA ADS] [CrossRef] [Google Scholar]
- Izotov, Y. I., Guseva, N. G., Fricke, K. J., & Papaderos, P. 2009, A&A, 503, 61 [NASA ADS] [CrossRef] [EDP Sciences] [Google Scholar]
- Izotov, Y. I., Guseva, N. G., & Thuan, T. X. 2011, ApJ, 728, 161 [NASA ADS] [CrossRef] [Google Scholar]
- Kakazu, Y., Cowie, L. L., & Hu, E. M. 2007, ApJ, 668, 853 [NASA ADS] [CrossRef] [Google Scholar]
- Karachentsev, I. D., Karachentseva, V. E., Huchtmeier, W. K., & Makarov, D. I. 2004, AJ, 127, 2031 [Google Scholar]
- Kauffmann, G., Heckman, T. M., Tremonti, C., et al. 2003, MNRAS, 346, 1055 [Google Scholar]
- Kennicutt, R. C., Jr. 1998, ARA&A, 36, 189 [Google Scholar]
- Kniazev, A. Y., Grebel, E. K., Hao, L., et al. 2003, ApJ, 593, 73 [NASA ADS] [CrossRef] [Google Scholar]
- Kniazev, A. Y., Pustilnik, S. A., Grebel, E. K., Lee, H., & Pramskij, A. G. 2004, ApJS, 153, 429 [NASA ADS] [CrossRef] [Google Scholar]
- Kunth, D., & Östlin, G. 2000, A&ARv, 10, 1 [NASA ADS] [CrossRef] [Google Scholar]
- Leitherer, C. 1990, ApJS, 73, 1 [NASA ADS] [CrossRef] [Google Scholar]
- Lequeux, J., Rayo, J. F., Serrano, A., Peimbert, M., & Torres-Peimbert, S. 1979, A&A, 80, 155 [NASA ADS] [Google Scholar]
- Makarova, L., Karachentsev, I. D., Rizzi, L., Tully, R. B., & Korotkova, G. 2009, MNRAS, 397, 1672 [NASA ADS] [CrossRef] [Google Scholar]
- Odewahn, S. C., & Aldering, G. 1995, AJ, 110, 2009 [NASA ADS] [CrossRef] [Google Scholar]
- Papaderos, P., Guseva, N. G., Izotov, Y. I., & Fricke, K. J. 2008, A&A, 491, 113 [NASA ADS] [CrossRef] [EDP Sciences] [Google Scholar]
- Patterson, R. J., & Thuan, T. X. 1996, ApJS, 107, 103 [NASA ADS] [CrossRef] [Google Scholar]
- Prochaska, J. X., Gawiser, E., Wolfe, A. M., Castro, S., & Djorgovski, S. G. 2003, ApJ, 595, L9 [NASA ADS] [CrossRef] [Google Scholar]
- Pustilnik, S. A., & Martin, J.-M. 2007, A&A, 464, 859 [NASA ADS] [CrossRef] [EDP Sciences] [Google Scholar]
- Pustilnik, S. A., Lipovetsky, V. A., Izotov, Y. I., et al. 1997, Astron. Lett., 23, 308 [NASA ADS] [Google Scholar]
- Pustilnik, S. A., Kniazev, A. Y., & Pramskij, A. G. 2005, A&A, 443, 91 [NASA ADS] [CrossRef] [EDP Sciences] [Google Scholar]
- Pustilnik, S. A., Teplyakova, A. L., Kniazev, A. Y., Martin, J.-M., & Burenkov, A. N. 2010, MNRAS, 401, 333 [NASA ADS] [CrossRef] [Google Scholar]
- Richer, M. G., & McCall, M. L. 1995, ApJ, 445, 642 [NASA ADS] [CrossRef] [Google Scholar]
- Russell, S. C., & Dopita, M. A. 1992, ApJ, 384, 508 [NASA ADS] [CrossRef] [Google Scholar]
- Sargent, W. L. W., & Searle, L. 1970, ApJ, 162, L155 [NASA ADS] [CrossRef] [Google Scholar]
- Skillman, E. D., Kennicutt, R. C., Jr., & Hodge, P. W. 1989, ApJ, 347, 875 [NASA ADS] [CrossRef] [Google Scholar]
- Stasińska, G. 1990, A&AS, 83, 501 [NASA ADS] [Google Scholar]
- Stasińska, G., & Izotov, Y. I. 2003, A&A, 397, 71 [NASA ADS] [CrossRef] [EDP Sciences] [Google Scholar]
- Stasińska, G., Cid Fernandes, R., Mateus, A., Sodré, L., & Asari, N. V. 2006, MNRAS, 371, 972 [NASA ADS] [CrossRef] [Google Scholar]
- Steidel, C. C., Adelberger, K. L., Shapley, A. E., et al. 2003, ApJ, 592, 728 [NASA ADS] [CrossRef] [Google Scholar]
- Thuan, T. X. 2008, in Low-metallicity Star Formation: From the First Stars to Dwarf Galaxies, eds. L. Hunt, S. C. Madden, & R. Schneider (Cambridge Univ. Press), 348 [Google Scholar]
- Thuan, T. X., & Izotov, Y. I. 2005, ApJS, 161, 240 [NASA ADS] [CrossRef] [Google Scholar]
- Thuan, T. X., Izotov, Y. I., & Lipovetsky, V. A. 1995, ApJ, 445, 108 [NASA ADS] [CrossRef] [Google Scholar]
- Thuan, T. X., Izotov, Y. I., & Lipovetsky, V. A. 1997, ApJ, 477, 661 [NASA ADS] [CrossRef] [Google Scholar]
- Thuan, T. X., Lecavelier des Etangs, A., & Izotov, Y. I. 2005, ApJ, 621, 269 [NASA ADS] [CrossRef] [EDP Sciences] [Google Scholar]
- van Zee, L. 2000, ApJ, 543, L31 [NASA ADS] [CrossRef] [Google Scholar]
- van Zee, L., Skillman, E. D., & Haynes, M. P. 2006, ApJ, 637, 269 [NASA ADS] [CrossRef] [Google Scholar]
- Whitford, A. E. 1958, AJ, 63, 201 [NASA ADS] [CrossRef] [Google Scholar]
- York, D. G., Adelman, J., Anderson, J. E., Jr., et al. 2000, AJ, 120, 1579 [Google Scholar]
All Tables
Abundances, extinction coefficients, Hβ equivalent widths, and absolute magnitudes.
Ionic and total heavy element abundances derived from the low-resolution MMT spectra.
Ionic and total heavy element abundances derived from the high-resolution MMT spectra.
All Figures
|
Fig. 4 Abundance ratios vs. oxygen abundance. The emission-line galaxies from this paper are shown by large circles, the filled circles representing galaxies with element abundances derived by the direct method, and the open ones galaxies with element abundances derived by the semi-empirical method; small filled circles are XMD emission-line galaxies from Izotov & Thuan (2004a), and dots are SDSS galaxies from Izotov et al. (2006a). |
| In the text | |
|
Fig. 5 a) Absolute g magnitude–oxygen abundance relation. The emission-line galaxies from this paper are shown by large circles, the filled circles representing galaxies with element abundances derived by the direct method, and the open ones galaxies with element abundances derived by the semi-empirical method; the XMD emission-line galaxies of Izotov & Thuan (2007) are shown by red asterisks, and the SDSS galaxies of Izotov et al. (2006a) by black dots. The dashed line is the linear regression to all these data. The solid line is the relation derived by Skillman et al. (1989), the dotted line is the one derived by Richer & McCall (1995), and the dot-dashed line is the one derived by Berg et al. (2012). For comparison, the most-metal deficient BCDs I Zw 18, SBS 0335–052W and SBS 0335–052E are shown by blue, magenta and red stars, respectively, and labelled. b) Hβ luminosity–oxygen abundance relation. The symbols are the same as in a). The solid line is the linear regression to all data, excluding I Zw 18, SBS 0335–052W and SBS 0335–052E. |
| In the text | |
|
Fig. 6 The Baldwin-Phillips-Terlevich diagram (Baldwin et al. 1981) for emission-line galaxies. The emission-line galaxies observed in this paper are shown by filled blue circles and the most-metal deficient star-forming galaxies known (Table 10) are shown by red filled circles, including observations of several knots of star formation in SBS 0335–052E. The Local Group dwarf irregular galaxy Leo A is encircled. Also, plotted are the 100 000 emission-line galaxies from SDSS DR7 (cloud of grey dots) and a sample of 803 luminous compact galaxies (LCGs, open black circles) (Izotov et al. 2011). The dashed line from Kauffmann et al. (2003) and the solid line from Stasińska et al. (2006) separate star-forming galaxies from active galactic nuclei. The latter lie in the right wing of the “butterfly”. |
| In the text | |
|
Fig. 1 3.5 m APO spectra of galaxies. |
| In the text | |
|
Fig. 1 continued. |
| In the text | |
|
Fig. 1 continued. |
| In the text | |
|
Fig. 1 continued. |
| In the text | |
|
Fig. 2 Low-resolution MMT spectra. |
| In the text | |
|
Fig. 2 continued. |
| In the text | |
|
Fig. 3 Medium-resolution MMT spectra. |
| In the text | |
|
Fig. 3 continued. |
| In the text | |
Current usage metrics show cumulative count of Article Views (full-text article views including HTML views, PDF and ePub downloads, according to the available data) and Abstracts Views on Vision4Press platform.
Data correspond to usage on the plateform after 2015. The current usage metrics is available 48-96 hours after online publication and is updated daily on week days.
Initial download of the metrics may take a while.