Fig. 6
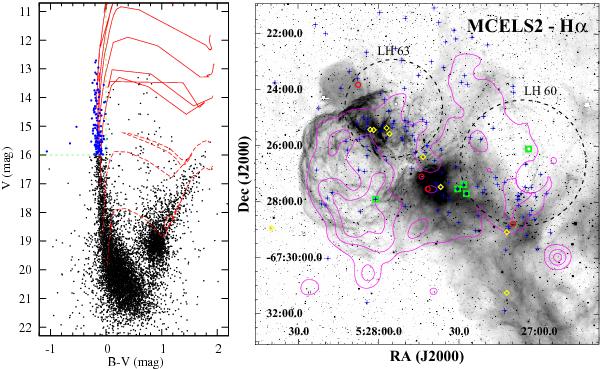
Left: colour–magnitude diagram (CMD) of the MCPS stars (Zaritsky et al. 2004) within 100 pc (~6.9′) of the central position of DEM L205. Geneva stellar evolution tracks (Lejeune & Schaerer 2001) are shown as red lines, for metallicity of 0.4 Z⊙ and initial masses of 3, 5 M⊙ (dashed lines) and 10, 15, 20, 25, and 40 M⊙ (solid lines), from bottom to top. The green dashed line shows the criteria used to identify the OB stars (V < 16 and B − V < 0). Stars satisfying these criteria are shown as blue dots. Right: MCELS2 Hα image of the SNR, with the soft X-ray contours in magenta. The blue plus signs show the positions of the OB candidates identified in the CMD and green squares identify Sanduleak OB stars. The black dashed circles encompass the nearby OB associations 60 and 63 from Lucke & Hodge (1970). Positions of definite (yellow diamond) and probable (red circle) YSOs from Gruendl & Chu (2009) are also shown.
Current usage metrics show cumulative count of Article Views (full-text article views including HTML views, PDF and ePub downloads, according to the available data) and Abstracts Views on Vision4Press platform.
Data correspond to usage on the plateform after 2015. The current usage metrics is available 48-96 hours after online publication and is updated daily on week days.
Initial download of the metrics may take a while.