Fig. 5
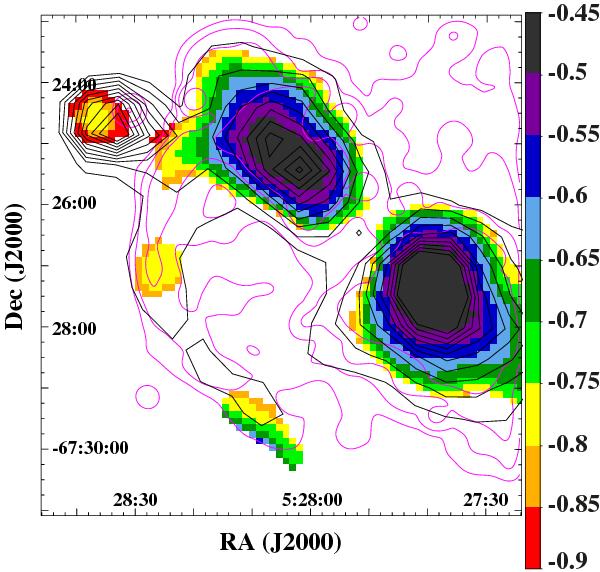
Spectral index map of DEM L205 between wavelength of 36, 20, and 6 cm, covering the same field as Fig. 4. The sidebar gives the spectral index α, as defined in the introduction. The 36 cm contours (black) are overlaid, with the same levels as in Fig. 4. The Hα structures (Figs. 1 and 2) are sketched by the magenta contours.
Current usage metrics show cumulative count of Article Views (full-text article views including HTML views, PDF and ePub downloads, according to the available data) and Abstracts Views on Vision4Press platform.
Data correspond to usage on the plateform after 2015. The current usage metrics is available 48-96 hours after online publication and is updated daily on week days.
Initial download of the metrics may take a while.