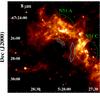
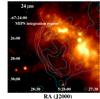
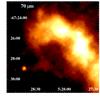
Fig. 4
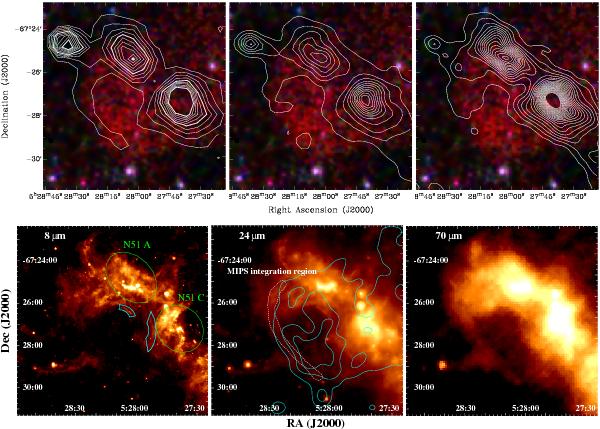
Top row: radio contours of DEM L205 overlaid on the X-ray image. Left: 36 cm contours from 5 to 50σ with 5σ steps (σ = 0.4 mJy/beam). Middle: 20 cm contours from 3 to 23σ with 2σ steps (σ = 1.3 mJy/beam). Right: 6 cm contours from 3 to 200σ with 9σ steps (σ = 0.1 mJy/beam). Beam sizes are 40′′ × 40′′ for the 36 and 20 cm images, and 41.8′′ × 28.5′′ at 6 cm. Note that the portion of the sky shown is smaller than in Fig. 2. Bottow row: Spitzer images of DEM L205 at 8, 24, and 70 μm (from left to right). All images show a similar portion of the sky as the radio images and are displayed logarithmically. The green ellipses on the 8 μm image show the positions of the two H ii regions seen in the 36 cm image (top left), and the cyan arcs indicate the 8 μm emission possibly associated with the SNR. The white dashed line shown in the 24 μm image marks the region where we measured the flux densities at 24 μm and 70 μm (Sect. 3.3). Soft X-ray contours are overlaid in cyan.
Current usage metrics show cumulative count of Article Views (full-text article views including HTML views, PDF and ePub downloads, according to the available data) and Abstracts Views on Vision4Press platform.
Data correspond to usage on the plateform after 2015. The current usage metrics is available 48-96 hours after online publication and is updated daily on week days.
Initial download of the metrics may take a while.