Fig. 3
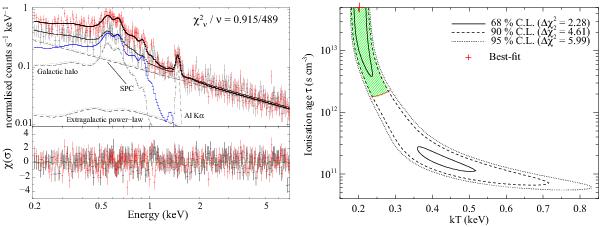
Left: EPIC-pn spectrum of DEM L205. The spectra in the background and source regions (grey and red data points, respectively) are modelled simultaneously. The background model components are shown by the dashed lines and labelled. The Sedov model used for the remnant is shown by the blue solid line. Residuals are shown in the lower panel in terms of σ. Right: the kT – τ parameter plane for the Sedov model. The 68, 90, and 95% CL contours are shown by the solid, dashed, and dotted black lines, respectively. The formal best-fit, occurring at the upper limit of the ionisation ages of the XSPEC model (5 × 10¹³ s cm-3) is marked by the red plus sign. The red line shows the 99% CL lower contour of emission measure obtained with the APEC model. The green hatching indicates the region where Δχ2 < 4.61 and EM is in the 99% CL range of the APEC model (see Sect. 3.1.3).
Current usage metrics show cumulative count of Article Views (full-text article views including HTML views, PDF and ePub downloads, according to the available data) and Abstracts Views on Vision4Press platform.
Data correspond to usage on the plateform after 2015. The current usage metrics is available 48-96 hours after online publication and is updated daily on week days.
Initial download of the metrics may take a while.