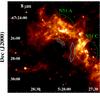
Fig. 2
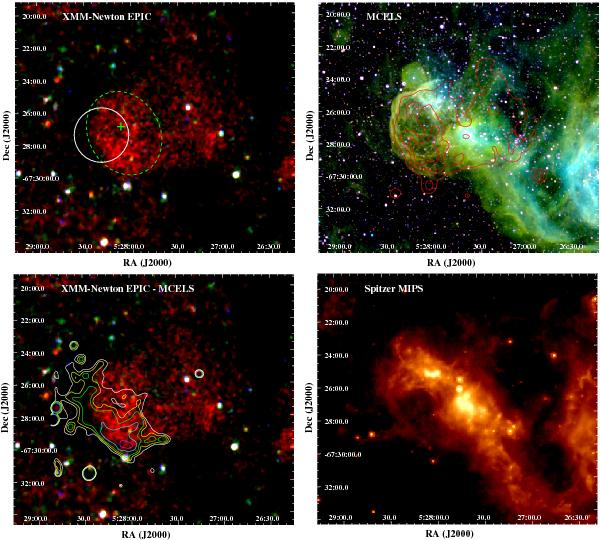
A multicolour view of DEM L205. Top left: X-ray colour image of the remnant, combining all EPIC cameras. Data from two overlapping observations are combined and smoothed (see Sect. 3.1.1 for details). The red, green, and blue components are soft, medium, and hard X-rays, as defined in the text. The white circle is the 90% confidence error of the [HP99] 534 position and the green cross is the central position of DEM L205. The green dashed ellipse (defined in Sect. 3.1.1) encompasses the X-ray emission and is used to define the nominal centre and extent of the remnant. Top right: the same region of the sky in the light of [S ii] (red), Hα (green), and [O iii] (blue), where all data are from the MCELS. The soft X-ray contours from the top left image are overlaid. Bottom left: same EPIC image as above but with [S ii]-to-Hα ratio contours from MCELS data. Levels are (inwards) 0.4, 0.45, 0.5, 0.6, and 0.7. Bottom right: the remnant as seen at 24 μm by Spitzer MIPS. Optical and IR images are displayed logarithmically.
Current usage metrics show cumulative count of Article Views (full-text article views including HTML views, PDF and ePub downloads, according to the available data) and Abstracts Views on Vision4Press platform.
Data correspond to usage on the plateform after 2015. The current usage metrics is available 48-96 hours after online publication and is updated daily on week days.
Initial download of the metrics may take a while.