Fig. 1
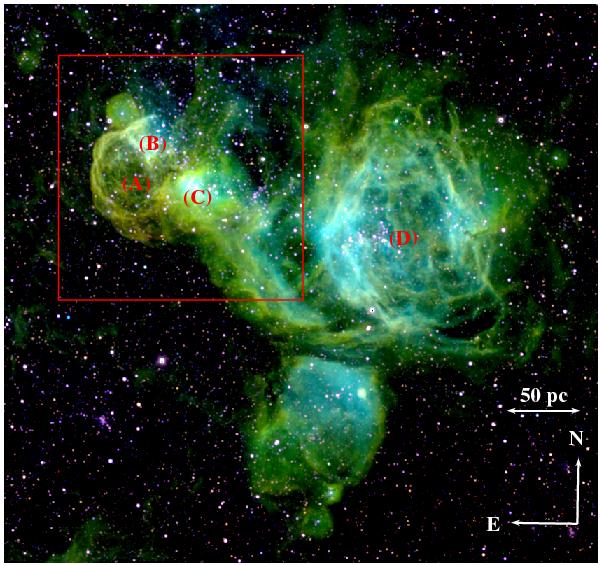
The giant H ii complex LHA 120-N 51 in the light of [S ii] (red), Hα (green), and [O iii] (blue), all data from MCELS (see Sect. 2.3). The red box delineates the area shown in Fig. 2. Noticeable substructures are : DEM L205 (A), the SNR candidate analysed in this paper; N51A (B) and N51C (C, also named DEM L201), two H ii regions also seen in the radio and the IR; the SB N51D, or DEM L192, in (D).
Current usage metrics show cumulative count of Article Views (full-text article views including HTML views, PDF and ePub downloads, according to the available data) and Abstracts Views on Vision4Press platform.
Data correspond to usage on the plateform after 2015. The current usage metrics is available 48-96 hours after online publication and is updated daily on week days.
Initial download of the metrics may take a while.