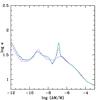
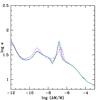
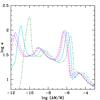
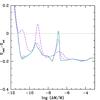
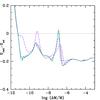
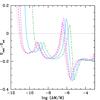
Fig. 9
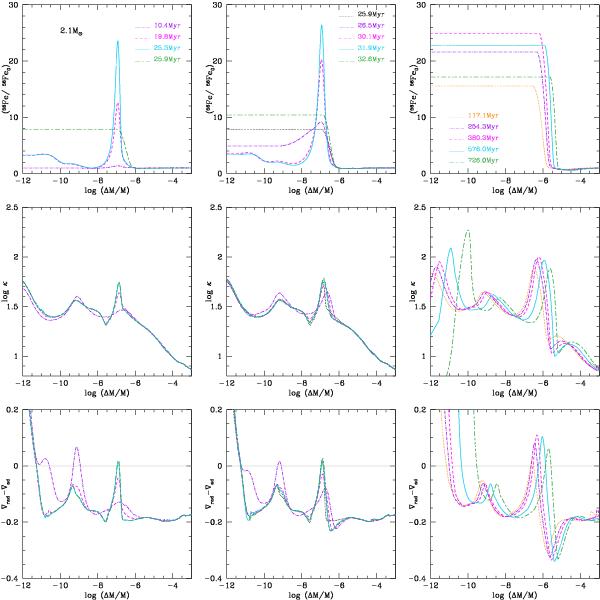
Internal structure of the 2.1 M⊙-model represented in Fig. 8. The profiles are represented as a function of the outer mass fraction and at various evolutionary steps. Upper panel: iron abundance profiles, 56Fe/56Fe0 represents the ratio between the current Fe abundance and its initial value (cf. Table 3). The various curves are defined in the upper panels and are valid for all the plots of the respective column. Middle panel: Rosseland opacity profiles. Lower panel: difference between the radiative and adiabatic gradients.
Current usage metrics show cumulative count of Article Views (full-text article views including HTML views, PDF and ePub downloads, according to the available data) and Abstracts Views on Vision4Press platform.
Data correspond to usage on the plateform after 2015. The current usage metrics is available 48-96 hours after online publication and is updated daily on week days.
Initial download of the metrics may take a while.