Fig. 8
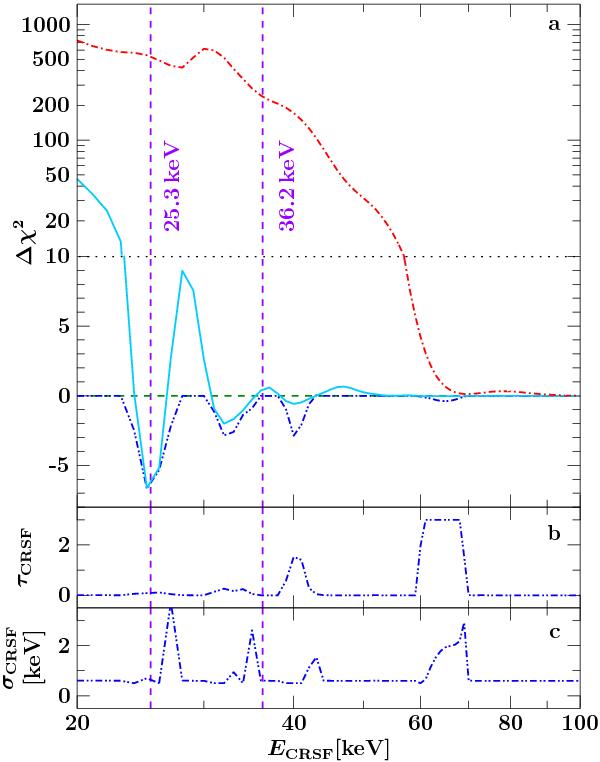
a) Difference of χ2 of the best fit of epoch I with frozen CRSF parameters (Fig. 2k) and the χ2 of the best fit without CRSF. The centroid energy was varied in steps of 1 keV. The red dashed-dotted curve displays the χ2 of the best fit when using τCRSF and σCRSF from Heindl et al. (2001). For the light blue solid curve the parameters from this work were used. The dark blue dashed-double-dotted curve shows this difference when the width as well as the depth (the upper limit has been set to 3) of the CRSF are allowed to vary, i.e., the same situation as in Fig. 2. The two additional minima in χ2 are discussed in Sect. 3.2. The horizontal dashed line indicates Δχ2 = 0, and the horizontal dotted line seperates the logarithmic and linear scaling in y-direction. The vertical dashed lines shows the position of the CRSF derived in Heindl et al. (2001) and this work. b), c) Results for the optical depth and width of the CRSF, respectively, when these parameters were allowed to vary. The plateau of the curve displayed in panel b at ~60–70 keV is caused by the upper limit for τCRSF of 3.
Current usage metrics show cumulative count of Article Views (full-text article views including HTML views, PDF and ePub downloads, according to the available data) and Abstracts Views on Vision4Press platform.
Data correspond to usage on the plateform after 2015. The current usage metrics is available 48-96 hours after online publication and is updated daily on week days.
Initial download of the metrics may take a while.