Fig. 2
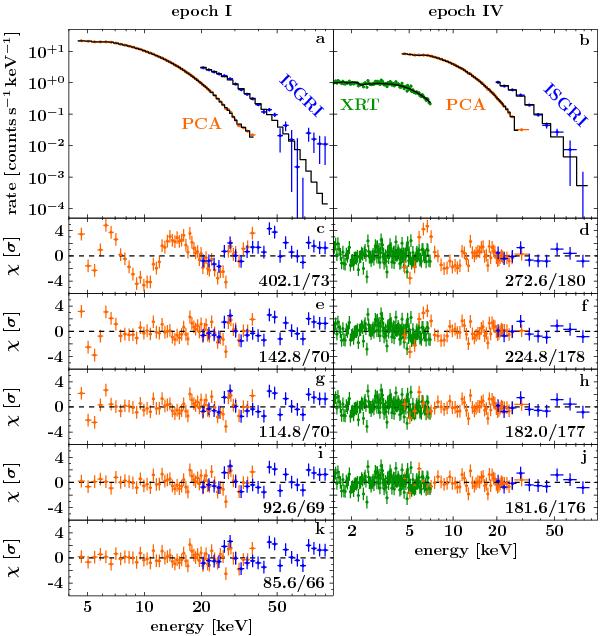
Panels a) and b) show two example spectra of XTE J1946+274. Epoch I is the spectrum with the highest count rate while epoch IV is the only data set for which all instruments are available. Histograms show the best-fit continuum. Panels c)–k) show the behavior of the residuals when the additional components of the spectral model are added one by one. Numbers at the bottom right of each panel indicate the best-fit statistics, χ2/d.o.f. c) and d) best fit using the Fermi-Dirac cutoff only; e) and f) residuals after adding the 10 keV feature to the continuum model; g) and h) residuals after adding the Galactic ridge emission to the PCA (for epoch I the flux of this model component was fixed to the result obtained from epochs III and IV); i) and j) residuals after adding the Fe Kα line to the model. Since in the model fit of epoch IV the depth of the CRSF is zero; panel j) displays the final result for epoch IV. In panel k) the CRSF was added to the data for epoch I. See also text for a discussion of the statistical significances of the Galactic ridge emission, the 10 keV feature, and the CRSF.
Current usage metrics show cumulative count of Article Views (full-text article views including HTML views, PDF and ePub downloads, according to the available data) and Abstracts Views on Vision4Press platform.
Data correspond to usage on the plateform after 2015. The current usage metrics is available 48-96 hours after online publication and is updated daily on week days.
Initial download of the metrics may take a while.