Fig. 1
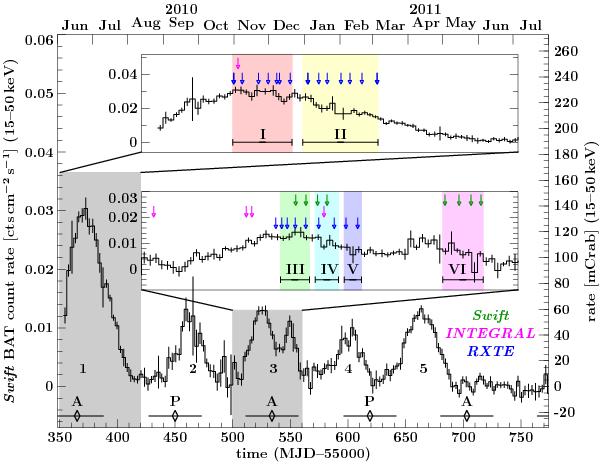
15–50 keV Swift/BAT light curve of the 2010/2011 outburst series. The times of periastron and apastron passages are marked by P and A, respectively. These epochs and the corresponding uncertainties were calculated using the orbital solution from Wilson et al. (2003). The insets provide a closer view on the first (Jun./Jul.) and the third (Nov./Dec.) outburst. The blue, red, and green arrows in these insets indicate the observations times for PCA, ISGRI, and XRT, respectively. Epochs over which data were summed for the time resolved spectral analysis are indicated with I to VI.
Current usage metrics show cumulative count of Article Views (full-text article views including HTML views, PDF and ePub downloads, according to the available data) and Abstracts Views on Vision4Press platform.
Data correspond to usage on the plateform after 2015. The current usage metrics is available 48-96 hours after online publication and is updated daily on week days.
Initial download of the metrics may take a while.