Fig. 4
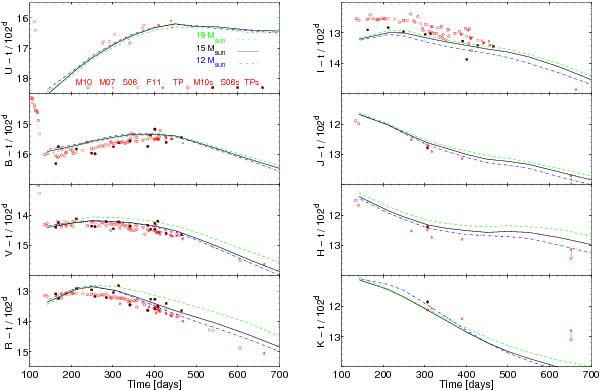
Normalized photometric evolution (all magnitudes have been subtracted by t/102 d to normalize to the 56Co decay) of the (reddened) 12 M⊙ (blue, dot-dashed), 15 M⊙ (black, solid), and 19 M⊙ (green, dashed) models, compared to observations (red points). T.P. means “this paper”. The M10s, S06s, and TPs data points are synthetic photometry from the observed spectra.
Current usage metrics show cumulative count of Article Views (full-text article views including HTML views, PDF and ePub downloads, according to the available data) and Abstracts Views on Vision4Press platform.
Data correspond to usage on the plateform after 2015. The current usage metrics is available 48-96 hours after online publication and is updated daily on week days.
Initial download of the metrics may take a while.