Free Access
Fig. 2
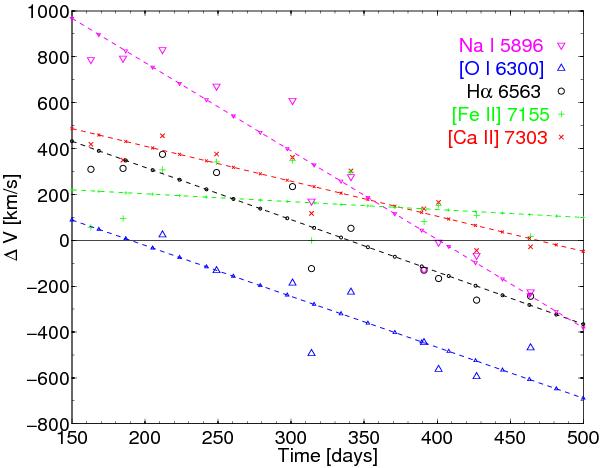
Velocity shifts of the peaks of the strongest emission lines in the observed spectra as function of time. The symbols are estimates of the peak positions from fitting a parabola to the part of the line with a flux higher than 85% of the peak value (95% for [Fe ii] λ7155). The lines are linear fits to the measured values.
Current usage metrics show cumulative count of Article Views (full-text article views including HTML views, PDF and ePub downloads, according to the available data) and Abstracts Views on Vision4Press platform.
Data correspond to usage on the plateform after 2015. The current usage metrics is available 48-96 hours after online publication and is updated daily on week days.
Initial download of the metrics may take a while.